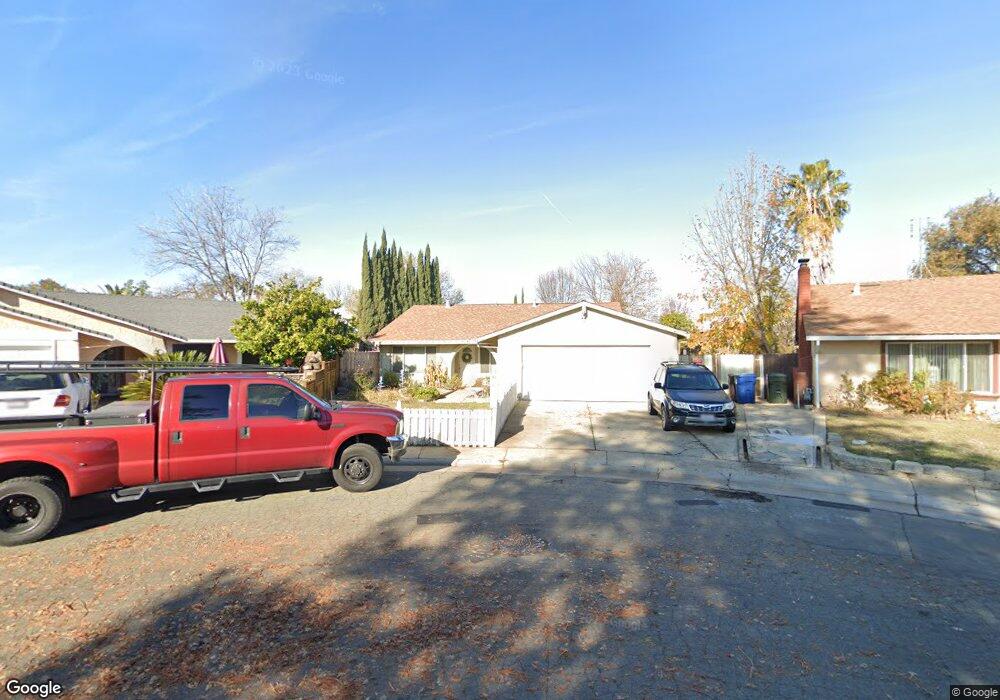
7417 Springvale Way Citrus Heights, CA 95621
Estimated Value: $476,000 - $511,000
4
Beds
2
Baths
1,524
Sq Ft
$322/Sq Ft
Est. Value
About This Home
This home is located at 7417 Springvale Way, Citrus Heights, CA 95621 and is currently estimated at $491,490, approximately $322 per square foot. 7417 Springvale Way is a home located in Sacramento County with nearby schools including Grand Oaks Elementary School, Sylvan Middle School, and Mesa Verde High School.
Ownership History
Date
Name
Owned For
Owner Type
Purchase Details
Closed on
Dec 1, 2010
Sold by
Four Counties Fund 1 Lp
Bought by
Seigle Amanda
Current Estimated Value
Home Financials for this Owner
Home Financials are based on the most recent Mortgage that was taken out on this home.
Original Mortgage
$151,200
Outstanding Balance
$99,844
Interest Rate
4.21%
Mortgage Type
New Conventional
Estimated Equity
$391,646
Purchase Details
Closed on
Mar 17, 2010
Sold by
Barbour Kimberly and Barbour Richard
Bought by
Four Counties Fund I Lp
Purchase Details
Closed on
Sep 21, 2006
Sold by
Barbour Richard R
Bought by
Barbour Kimberly D
Purchase Details
Closed on
Jan 12, 2006
Sold by
Grover Joseph and Grover Noel Michael
Bought by
Barbour Kimberly and Barbour Richard
Home Financials for this Owner
Home Financials are based on the most recent Mortgage that was taken out on this home.
Original Mortgage
$280,000
Interest Rate
1.75%
Mortgage Type
Negative Amortization
Create a Home Valuation Report for This Property
The Home Valuation Report is an in-depth analysis detailing your home's value as well as a comparison with similar homes in the area
Home Values in the Area
Average Home Value in this Area
Purchase History
| Date | Buyer | Sale Price | Title Company |
|---|---|---|---|
| Seigle Amanda | $189,000 | Chicago Title Company | |
| Four Counties Fund I Lp | $148,400 | None Available | |
| Barbour Kimberly D | -- | None Available | |
| Barbour Kimberly | -- | Alliance Title Company |
Source: Public Records
Mortgage History
| Date | Status | Borrower | Loan Amount |
|---|---|---|---|
| Open | Seigle Amanda | $151,200 | |
| Previous Owner | Barbour Kimberly | $280,000 |
Source: Public Records
Tax History
| Year | Tax Paid | Tax Assessment Tax Assessment Total Assessment is a certain percentage of the fair market value that is determined by local assessors to be the total taxable value of land and additions on the property. | Land | Improvement |
|---|---|---|---|---|
| 2025 | $2,943 | $247,709 | $125,166 | $122,543 |
| 2024 | $2,943 | $242,853 | $122,712 | $120,141 |
| 2023 | $2,869 | $238,092 | $120,306 | $117,786 |
| 2022 | $2,854 | $233,425 | $117,948 | $115,477 |
| 2021 | $2,807 | $228,849 | $115,636 | $113,213 |
| 2020 | $2,755 | $226,504 | $114,451 | $112,053 |
| 2019 | $2,616 | $222,063 | $112,207 | $109,856 |
| 2018 | $2,525 | $212,807 | $110,007 | $102,800 |
| 2017 | $2,499 | $208,635 | $107,850 | $100,785 |
| 2016 | $2,334 | $204,545 | $105,736 | $98,809 |
| 2015 | $2,293 | $201,473 | $104,148 | $97,325 |
| 2014 | $2,244 | $197,527 | $102,108 | $95,419 |
Source: Public Records
Map
Nearby Homes
- 7512 Bufflehead Ln
- 7324 White River Ln Unit 166
- 7535 Golden Eye Ln Unit 126
- 7533 Pintail Cir
- 5924 Mallard Ln Unit 231
- 5832 Alameda Ln Unit 138
- 7101 Schooner Way
- 7547 Golden Eye Ln Unit 123
- 7601 Pintail Cir
- 7600 Golden Eye Ln Unit 43
- 7217 Springleaf Ct
- 7421 Topanga Ln Unit 264
- 5825 Hobbs Ln Unit 68
- 6016 6016 Cackler Ln
- 7036 Catamaran Dr
- 5922 Cackler Ln Unit 83
- 6249 Sunmist Way
- 5913 Cackler Ln Unit 62
- 7242 Aberfeldy Way
- 6508 Skylane Dr
- 7413 Springvale Way
- 7421 Springvale Way
- 6104 Miravale Ct
- 6024 Windlass Ct
- 7409 Springvale Way
- 7425 Springvale Way
- 6020 Windlass Ct
- 6028 Windlass Ct
- 6100 Miravale Ct
- 6032 Windlass Ct
- 6112 Miravale Ct
- 7410 Springvale Way
- 7405 Springvale Way
- 7429 Springvale Way
- 6016 Windlass Ct
- 6036 Windlass Ct
- 6101 Miravale Ct
- 6116 Miravale Ct
- 7426 Springvale Way
- 7401 Parkvale Way
Your Personal Tour Guide
Ask me questions while you tour the home.