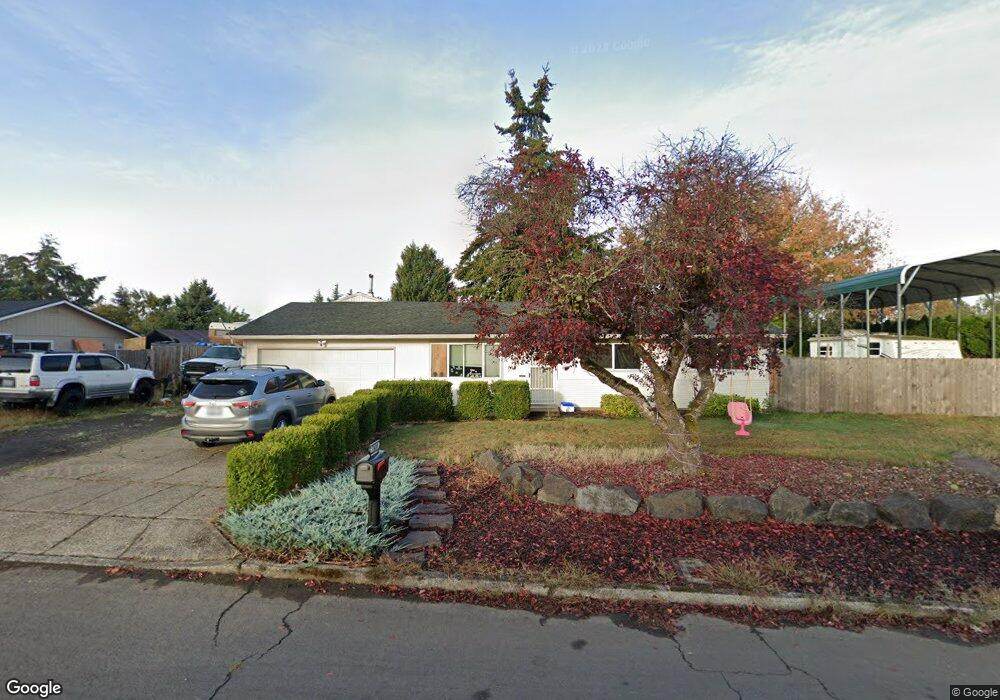
7418 NE 109th Ave Vancouver, WA 98662
Orchards Area NeighborhoodEstimated Value: $401,000 - $450,000
3
Beds
2
Baths
1,288
Sq Ft
$337/Sq Ft
Est. Value
About This Home
This home is located at 7418 NE 109th Ave, Vancouver, WA 98662 and is currently estimated at $434,697, approximately $337 per square foot. 7418 NE 109th Ave is a home located in Clark County with nearby schools including Orchards Elementary School, Covington Middle School, and Heritage High School.
Ownership History
Date
Name
Owned For
Owner Type
Purchase Details
Closed on
Jan 5, 2017
Sold by
Hartley Ronald C
Bought by
Tanner Travis
Current Estimated Value
Home Financials for this Owner
Home Financials are based on the most recent Mortgage that was taken out on this home.
Original Mortgage
$265,109
Outstanding Balance
$220,804
Interest Rate
4.5%
Mortgage Type
FHA
Estimated Equity
$213,893
Purchase Details
Closed on
Jan 19, 2001
Sold by
Koppert Glenda L and Koppert Bruce L
Bought by
Hartley Ronald C
Home Financials for this Owner
Home Financials are based on the most recent Mortgage that was taken out on this home.
Original Mortgage
$117,085
Interest Rate
7.41%
Mortgage Type
VA
Purchase Details
Closed on
Jan 7, 2000
Sold by
Koppert Glenda L
Bought by
Koppert Glenda L and Koppert Bruce L
Purchase Details
Closed on
Nov 17, 1995
Sold by
Schafer Craig A
Bought by
Whitney Glenda L
Home Financials for this Owner
Home Financials are based on the most recent Mortgage that was taken out on this home.
Original Mortgage
$64,750
Interest Rate
7.58%
Create a Home Valuation Report for This Property
The Home Valuation Report is an in-depth analysis detailing your home's value as well as a comparison with similar homes in the area
Home Values in the Area
Average Home Value in this Area
Purchase History
| Date | Buyer | Sale Price | Title Company |
|---|---|---|---|
| Tanner Travis | $270,000 | Wfg Natl Title Of Clark Cnty | |
| Hartley Ronald C | $114,789 | Washington Title Company | |
| Koppert Glenda L | -- | -- | |
| Whitney Glenda L | $92,500 | Chicago Title Insurance Co |
Source: Public Records
Mortgage History
| Date | Status | Borrower | Loan Amount |
|---|---|---|---|
| Open | Tanner Travis | $265,109 | |
| Previous Owner | Hartley Ronald C | $117,085 | |
| Previous Owner | Whitney Glenda L | $64,750 |
Source: Public Records
Tax History Compared to Growth
Tax History
| Year | Tax Paid | Tax Assessment Tax Assessment Total Assessment is a certain percentage of the fair market value that is determined by local assessors to be the total taxable value of land and additions on the property. | Land | Improvement |
|---|---|---|---|---|
| 2025 | $3,877 | $394,844 | $198,000 | $196,844 |
| 2024 | $3,627 | $378,996 | $198,000 | $180,996 |
| 2023 | $3,655 | $372,004 | $195,000 | $177,004 |
| 2022 | $3,359 | $369,588 | $195,000 | $174,588 |
| 2021 | $3,210 | $316,068 | $166,500 | $149,568 |
| 2020 | $2,818 | $284,228 | $150,000 | $134,228 |
| 2019 | $2,456 | $249,886 | $129,580 | $120,306 |
| 2018 | $2,702 | $234,534 | $0 | $0 |
| 2017 | $2,321 | $208,157 | $0 | $0 |
| 2016 | $2,143 | $185,796 | $0 | $0 |
| 2015 | $2,122 | $159,373 | $0 | $0 |
| 2014 | -- | $150,243 | $0 | $0 |
| 2013 | -- | $133,846 | $0 | $0 |
Source: Public Records
Map
Nearby Homes
- 7817 NE 107th Ave
- 7215 NE 105th Ave
- 10703 NE 70th St
- 11515 NE 71st St Unit 11
- 11515 NE 71st St Unit 70
- 10418 NE 66th St
- 10611 NE 85th Cir
- 11215 NE 85th Cir
- 10915 NE 86th Way
- 10409 NE 63rd Cir
- 10503 NE 88th St
- 9604 NE 83rd Cir
- 8100 NE 94th Ave
- 9217 NE 81st Loop
- 10105 NE 61st Cir
- 11309 NE Conifer Dr
- 11009 NE Fourth Plain Blvd
- 9111 NE 73rd St
- 10213 NE 58th St
- 9105 NE 68th St
- 7509 NE 108th Ct
- 7507 NE 108th Ct
- 7506 NE 109th Ave
- 7412 NE 109th Ave
- 7511 NE 108th Ct
- 7501 NE 109th Ave
- 7503 NE 108th Ct
- 7409 NE 109th Ave
- 7513 NE 108th Ct
- 7514 NE 109th Ave
- 10900 NE 75th St
- 7513 NE 109th Ave
- 7508 NE 108th Ct
- 7510 NE 108th Ct
- 10716 NE 75th St
- 10901 NE 75th St
- 7512 NE 108th Ct
- 7316 NE 109th Ave
- 10719 NE 76th St