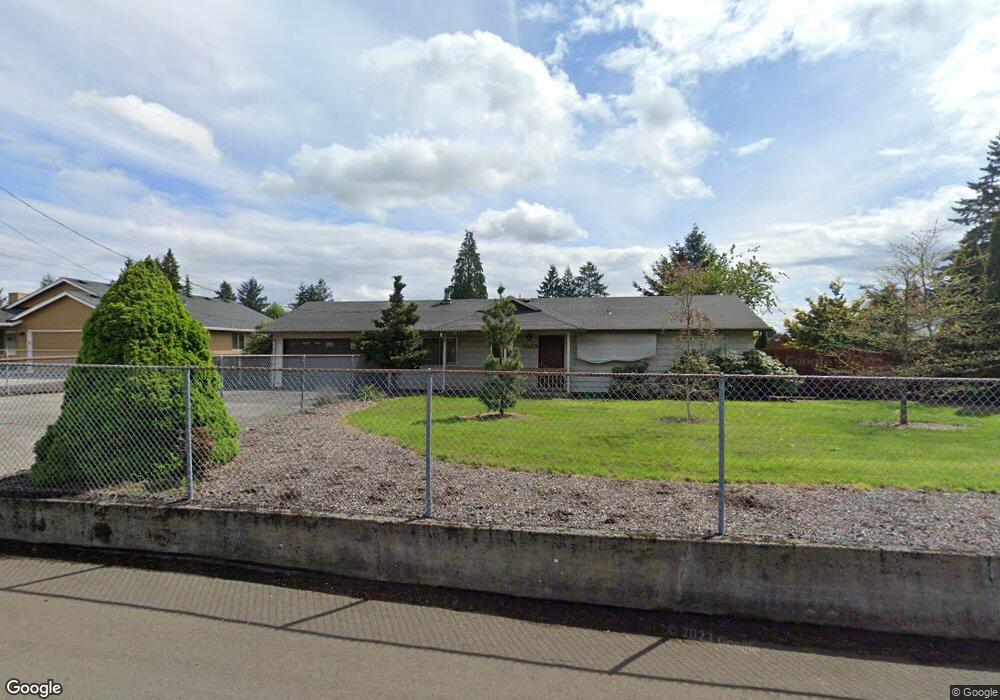
7419 NE 126th Ct Vancouver, WA 98682
Orchards Area NeighborhoodEstimated Value: $427,000 - $445,164
3
Beds
2
Baths
968
Sq Ft
$450/Sq Ft
Est. Value
About This Home
This home is located at 7419 NE 126th Ct, Vancouver, WA 98682 and is currently estimated at $435,291, approximately $449 per square foot. 7419 NE 126th Ct is a home located in Clark County with nearby schools including Sifton Elementary School, Covington Middle School, and Heritage High School.
Ownership History
Date
Name
Owned For
Owner Type
Purchase Details
Closed on
Jun 12, 2002
Sold by
Ramirez Hugo and Ramirez Maria
Bought by
Barnard James J
Current Estimated Value
Home Financials for this Owner
Home Financials are based on the most recent Mortgage that was taken out on this home.
Original Mortgage
$126,000
Outstanding Balance
$53,012
Interest Rate
6.74%
Estimated Equity
$382,279
Purchase Details
Closed on
Feb 24, 1999
Sold by
Diego Viveros Maria D
Bought by
Ramirez Hugo
Home Financials for this Owner
Home Financials are based on the most recent Mortgage that was taken out on this home.
Original Mortgage
$118,817
Interest Rate
6.78%
Mortgage Type
FHA
Purchase Details
Closed on
Feb 12, 1999
Sold by
Bade Curtis Hayes
Bought by
Ramirez Hugo
Home Financials for this Owner
Home Financials are based on the most recent Mortgage that was taken out on this home.
Original Mortgage
$118,817
Interest Rate
6.78%
Mortgage Type
FHA
Create a Home Valuation Report for This Property
The Home Valuation Report is an in-depth analysis detailing your home's value as well as a comparison with similar homes in the area
Home Values in the Area
Average Home Value in this Area
Purchase History
| Date | Buyer | Sale Price | Title Company |
|---|---|---|---|
| Barnard James J | $129,900 | Cascade Title | |
| Ramirez Hugo | -- | Chicago Title Insurance Co | |
| Ramirez Hugo | -- | Chicago Title Insurance Co |
Source: Public Records
Mortgage History
| Date | Status | Borrower | Loan Amount |
|---|---|---|---|
| Open | Barnard James J | $126,000 | |
| Previous Owner | Ramirez Hugo | $118,817 |
Source: Public Records
Tax History Compared to Growth
Tax History
| Year | Tax Paid | Tax Assessment Tax Assessment Total Assessment is a certain percentage of the fair market value that is determined by local assessors to be the total taxable value of land and additions on the property. | Land | Improvement |
|---|---|---|---|---|
| 2025 | $3,873 | $375,280 | $201,640 | $173,640 |
| 2024 | $3,669 | $380,412 | $201,640 | $178,772 |
| 2023 | $3,537 | $378,661 | $200,160 | $178,501 |
| 2022 | $3,204 | $359,370 | $191,280 | $168,090 |
| 2021 | $2,931 | $302,970 | $160,200 | $142,770 |
| 2020 | $3,067 | $260,522 | $138,000 | $122,522 |
| 2019 | $2,641 | $274,240 | $156,100 | $118,140 |
| 2018 | $2,906 | $254,475 | $0 | $0 |
| 2017 | $2,530 | $226,103 | $0 | $0 |
| 2016 | $2,245 | $204,872 | $0 | $0 |
| 2015 | $2,135 | $168,840 | $0 | $0 |
| 2014 | -- | $152,762 | $0 | $0 |
| 2013 | -- | $137,329 | $0 | $0 |
Source: Public Records
Map
Nearby Homes
- 12707 NE 76th St
- 13012 NE 76th St
- 6912 NE 131st Ave Unit 10
- 12801 NE 83rd St
- 13001 NE 83rd St
- 13605 NE 72nd St
- 11025 NE 137th Ave
- The 2038 Plan at Stone's Throw
- The 1520 Plan at Stone's Throw
- The 2260 Plan at Stone's Throw
- The 1594 Plan at Stone's Throw
- The 1315 Plan at Stone's Throw
- The 1670 Plan at Stone's Throw
- The 1609 Plan at Stone's Throw
- The 2321 Plan at Stone's Throw
- 13303 NE 84th St Unit Lot 46
- 13329 NE 83rd Way
- 8605 NE 136th Ave Unit 135
- 8403 NE 133rd Ave
- 13504 NE 86th St Unit 149
- 7503 NE 126th Ct
- 7413 NE 126th Ct
- 7409 NE 126th Ct
- 7505 NE 126th Ct
- 7412 NE 128th Ave
- 7404 NE 128th Ave
- 7418 NE 128th Ave
- 7507 NE 126th Ct
- 7416 NE 126th Ct
- 7511 NE 126th Ct
- 7500 NE 126th Ct
- 7320 NE 128th Ave
- 12604 NE 73rd St
- 12602 NE 73rd St
- 7408 NE 126th Ct
- 12610 NE 73rd St
- 7504 NE 126th Ct
- 7512 NE 126th Ct
- 7312 NE 128th Ave
- 7508 NE 126th Ct