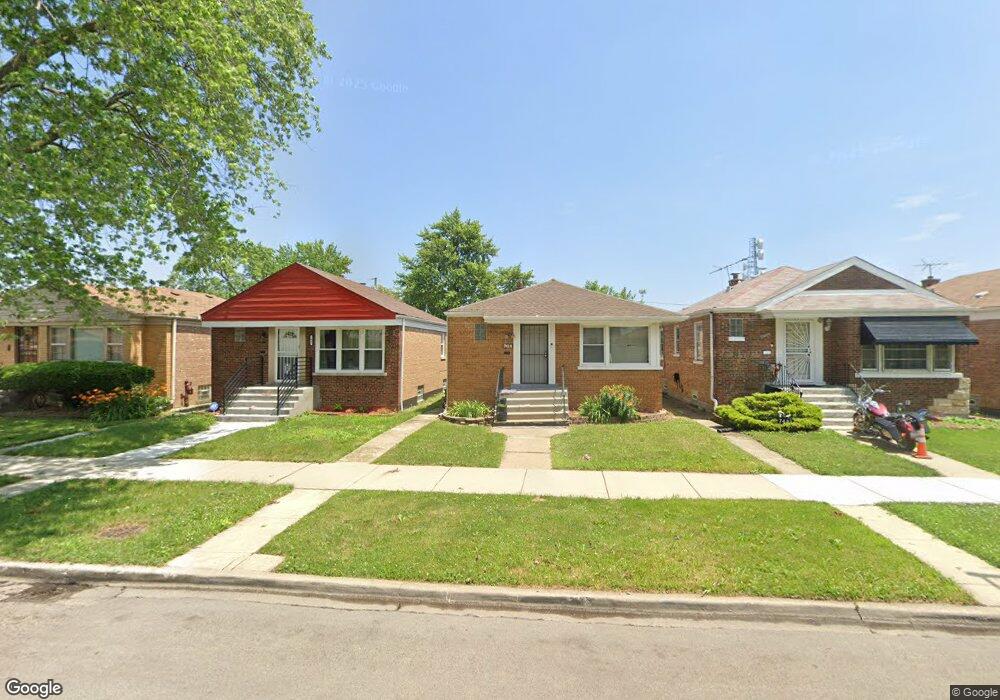
7419 S Maplewood Ave Chicago, IL 60629
Marquette Park NeighborhoodEstimated Value: $213,000 - $276,000
2
Beds
1
Bath
816
Sq Ft
$293/Sq Ft
Est. Value
About This Home
This home is located at 7419 S Maplewood Ave, Chicago, IL 60629 and is currently estimated at $238,813, approximately $292 per square foot. 7419 S Maplewood Ave is a home located in Cook County with nearby schools including McKay Elementary School, Gage Park High School, and Catalyst Maria Charter School.
Ownership History
Date
Name
Owned For
Owner Type
Purchase Details
Closed on
Aug 29, 2023
Sold by
Sweet Home Chicago Management Llc
Bought by
Aaa Real Estate Management Llc
Current Estimated Value
Purchase Details
Closed on
Jul 16, 2015
Sold by
Frazier Sandra M
Bought by
Sweet Home Chicago Management Llc
Purchase Details
Closed on
Jul 28, 2005
Sold by
Roland Arie
Bought by
Frazier Sandra M
Home Financials for this Owner
Home Financials are based on the most recent Mortgage that was taken out on this home.
Original Mortgage
$141,000
Interest Rate
5.66%
Mortgage Type
Fannie Mae Freddie Mac
Purchase Details
Closed on
Mar 18, 1997
Sold by
Averhart Yvonne
Bought by
Roland Arie
Home Financials for this Owner
Home Financials are based on the most recent Mortgage that was taken out on this home.
Original Mortgage
$40,100
Interest Rate
7.82%
Create a Home Valuation Report for This Property
The Home Valuation Report is an in-depth analysis detailing your home's value as well as a comparison with similar homes in the area
Home Values in the Area
Average Home Value in this Area
Purchase History
| Date | Buyer | Sale Price | Title Company |
|---|---|---|---|
| Aaa Real Estate Management Llc | -- | None Listed On Document | |
| Sweet Home Chicago Management Llc | $33,500 | Attorney | |
| Frazier Sandra M | $141,000 | Atg Search | |
| Roland Arie | -- | Chicago Title Insurance Co |
Source: Public Records
Mortgage History
| Date | Status | Borrower | Loan Amount |
|---|---|---|---|
| Previous Owner | Frazier Sandra M | $141,000 | |
| Previous Owner | Roland Arie | $40,100 |
Source: Public Records
Tax History Compared to Growth
Tax History
| Year | Tax Paid | Tax Assessment Tax Assessment Total Assessment is a certain percentage of the fair market value that is determined by local assessors to be the total taxable value of land and additions on the property. | Land | Improvement |
|---|---|---|---|---|
| 2024 | $2,250 | $16,262 | $2,268 | $13,994 |
| 2023 | $2,384 | $10,605 | $3,024 | $7,581 |
| 2022 | $2,384 | $11,524 | $3,024 | $8,500 |
| 2021 | $2,317 | $11,524 | $3,024 | $8,500 |
| 2020 | $2,250 | $10,033 | $3,024 | $7,009 |
| 2019 | $2,254 | $11,148 | $3,024 | $8,124 |
| 2018 | $2,216 | $11,148 | $3,024 | $8,124 |
| 2017 | $2,191 | $9,577 | $2,646 | $6,931 |
| 2016 | $1,792 | $10,930 | $2,646 | $8,284 |
| 2015 | $1,620 | $10,930 | $2,646 | $8,284 |
| 2014 | $1,457 | $9,930 | $2,457 | $7,473 |
| 2013 | $1,418 | $9,930 | $2,457 | $7,473 |
Source: Public Records
Map
Nearby Homes
- 7408 S Campbell Ave
- 7448 S Maplewood Ave
- 7319 S Campbell Ave
- 7255 S Artesian Ave
- 7604 S Campbell Ave
- 7310 S Claremont Ave
- 7255 S Washtenaw Ave
- 7212 S Campbell Ave
- 7245 S Washtenaw Ave
- 7212 S Artesian Ave
- 7426 S Oakley Ave
- 7319 S Claremont Ave
- 7324 S Oakley Ave
- 7156 S Artesian Ave
- 7321 S Oakley Ave
- 7208 S Claremont Ave
- 7150 S Talman Ave
- 7240 S Oakley Ave
- 7240 S Fairfield Ave
- 7141 S Artesian Ave
- 7417 S Maplewood Ave
- 7423 S Maplewood Ave
- 7425 S Maplewood Ave
- 7415 S Maplewood Ave
- 7429 S Maplewood Ave
- 7411 S Maplewood Ave
- 7407 S Maplewood Ave
- 7431 S Maplewood Ave
- 7420 S Campbell Ave
- 7416 S Campbell Ave
- 7422 S Campbell Ave
- 7414 S Campbell Ave
- 7405 S Maplewood Ave
- 7410 S Campbell Ave
- 7401 S Maplewood Ave
- 7418 S Maplewood Ave
- 7416 S Maplewood Ave
- 7422 S Maplewood Ave
- 7414 S Maplewood Ave
- 7404 S Campbell Ave