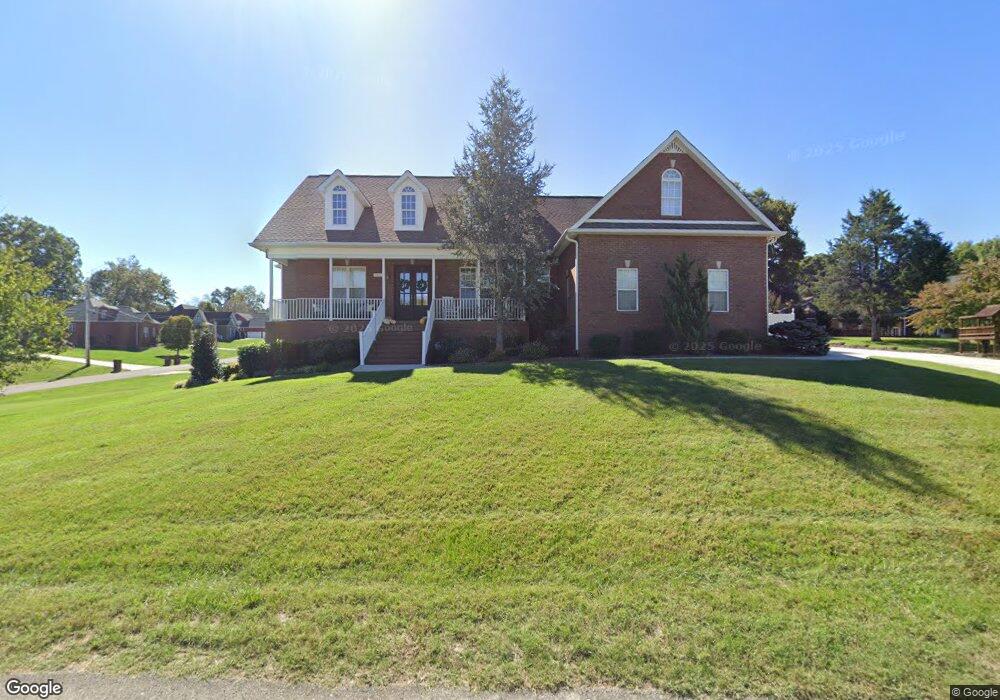
742 Coveview Cir Cookeville, TN 38506
Estimated Value: $461,623 - $546,000
3
Beds
3
Baths
2,707
Sq Ft
$188/Sq Ft
Est. Value
About This Home
This home is located at 742 Coveview Cir, Cookeville, TN 38506 and is currently estimated at $510,156, approximately $188 per square foot. 742 Coveview Cir is a home located in Putnam County with nearby schools including Algood Middle School, Algood Elementary School, and Cookeville High School.
Ownership History
Date
Name
Owned For
Owner Type
Purchase Details
Closed on
Sep 30, 2011
Sold by
Irwin Mark
Bought by
Crouch John M
Current Estimated Value
Home Financials for this Owner
Home Financials are based on the most recent Mortgage that was taken out on this home.
Original Mortgage
$140,000
Outstanding Balance
$96,219
Interest Rate
4.26%
Mortgage Type
Commercial
Estimated Equity
$413,937
Purchase Details
Closed on
Jul 20, 2007
Sold by
Chaffin Barry R and Chaffin Mary B
Bought by
Mark Irwin and Mark Jennifer
Home Financials for this Owner
Home Financials are based on the most recent Mortgage that was taken out on this home.
Original Mortgage
$205,600
Interest Rate
8.75%
Purchase Details
Closed on
Oct 2, 2006
Sold by
Ann Burton Claude
Bought by
Chaffin Barry R and Chaffin Mary B
Purchase Details
Closed on
Mar 11, 1998
Bought by
Brown Richardson Rozell Burton %Patricia
Create a Home Valuation Report for This Property
The Home Valuation Report is an in-depth analysis detailing your home's value as well as a comparison with similar homes in the area
Home Values in the Area
Average Home Value in this Area
Purchase History
| Date | Buyer | Sale Price | Title Company |
|---|---|---|---|
| Crouch John M | $200,000 | -- | |
| Mark Irwin | $254,900 | -- | |
| Chaffin Barry R | $22,000 | -- | |
| Brown Richardson Rozell Burton %Patricia | $66,000 | -- |
Source: Public Records
Mortgage History
| Date | Status | Borrower | Loan Amount |
|---|---|---|---|
| Open | Crouch John M | $140,000 | |
| Previous Owner | Brown Richardson Rozell Burton %Patricia | $205,600 | |
| Previous Owner | Brown Richardson Rozell Burton %Patricia | $49,300 |
Source: Public Records
Tax History Compared to Growth
Tax History
| Year | Tax Paid | Tax Assessment Tax Assessment Total Assessment is a certain percentage of the fair market value that is determined by local assessors to be the total taxable value of land and additions on the property. | Land | Improvement |
|---|---|---|---|---|
| 2024 | $2,462 | $92,575 | $10,000 | $82,575 |
| 2023 | $2,463 | $92,575 | $10,000 | $82,575 |
| 2022 | $2,288 | $92,575 | $10,000 | $82,575 |
| 2021 | $2,288 | $92,575 | $10,000 | $82,575 |
| 2020 | $2,203 | $92,575 | $10,000 | $82,575 |
| 2019 | $2,203 | $75,300 | $10,000 | $65,300 |
| 2018 | $2,056 | $75,300 | $10,000 | $65,300 |
| 2017 | $2,056 | $75,300 | $10,000 | $65,300 |
| 2016 | $2,056 | $75,300 | $10,000 | $65,300 |
| 2015 | $2,112 | $75,300 | $10,000 | $65,300 |
| 2014 | $1,936 | $69,011 | $0 | $0 |
Source: Public Records
Map
Nearby Homes
- 936 N Plantation Dr
- 3382 Norfolk Dr
- 1128 N Plantation Dr
- 3524 Heritage Green Way
- 3516 Heritage Green Way
- 322 New Heritage Dr
- 1303 N Plantation Dr
- 333 New Heritage Dr
- 0 Burton Cove Rd
- 251 Haven Ln
- 136 Phillips Bend Ct
- 292 Williams Cir
- 1500 N Plantation Dr
- 2933 Old Walton Cir
- 546 Geeseway Dr
- 1566 N Plantation Dr
- 0 S Plantation Dr
- 461 S Plantation Dr
- 742 Cove View Cir
- 734 Cove View Cir
- 734 Coveview Cir
- 774 Coveview Cir
- 774 Cove View Cir
- 747 Cove View Cir
- 747 Coveview Cir
- 730 Coveview Cir
- 730 Cove View Cir
- 753 Cove View Cir
- 778 Cove View Cir
- 778 Coveview Cir
- 735 Cove View Cir
- 735 Coveview Cir
- 726 Cove View Cir
- 731 Cove View Cir
- 743 Cove View Cir
- 784 Cove View Cir
- 784 Coveview Cir