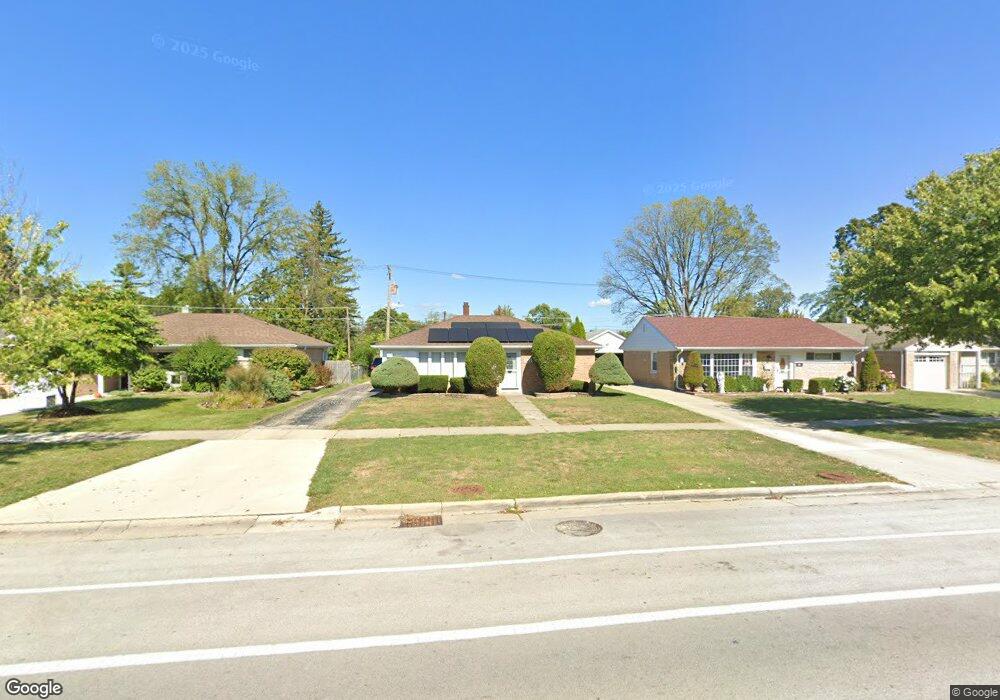
742 E Algonquin Rd Des Plaines, IL 60016
Estimated Value: $316,000 - $353,000
2
Beds
1
Bath
999
Sq Ft
$331/Sq Ft
Est. Value
About This Home
This home is located at 742 E Algonquin Rd, Des Plaines, IL 60016 and is currently estimated at $330,994, approximately $331 per square foot. 742 E Algonquin Rd is a home located in Cook County with nearby schools including Forest Elementary School, Algonquin Middle School, and Maine West High School.
Ownership History
Date
Name
Owned For
Owner Type
Purchase Details
Closed on
Oct 21, 1999
Sold by
Juric Jova and Chiaramonte Renee
Bought by
Alejandre Rafael and Alejandre Aceneth M
Current Estimated Value
Home Financials for this Owner
Home Financials are based on the most recent Mortgage that was taken out on this home.
Original Mortgage
$117,000
Interest Rate
7.81%
Purchase Details
Closed on
Feb 28, 1997
Sold by
Malkowski Kathleen A and Juric Jova
Bought by
Juric Jova and Chiaramonte Renee M
Purchase Details
Closed on
May 24, 1995
Sold by
Johler Robert M and Johler Joy A
Bought by
Juric Jova and Malkowski Kathleen A
Home Financials for this Owner
Home Financials are based on the most recent Mortgage that was taken out on this home.
Original Mortgage
$120,000
Interest Rate
8.4%
Create a Home Valuation Report for This Property
The Home Valuation Report is an in-depth analysis detailing your home's value as well as a comparison with similar homes in the area
Home Values in the Area
Average Home Value in this Area
Purchase History
| Date | Buyer | Sale Price | Title Company |
|---|---|---|---|
| Alejandre Rafael | $147,000 | -- | |
| Juric Jova | -- | -- | |
| Juric Jova | $130,000 | -- |
Source: Public Records
Mortgage History
| Date | Status | Borrower | Loan Amount |
|---|---|---|---|
| Previous Owner | Alejandre Rafael | $117,000 | |
| Previous Owner | Juric Jova | $120,000 |
Source: Public Records
Tax History
| Year | Tax Paid | Tax Assessment Tax Assessment Total Assessment is a certain percentage of the fair market value that is determined by local assessors to be the total taxable value of land and additions on the property. | Land | Improvement |
|---|---|---|---|---|
| 2025 | $5,981 | $26,000 | $6,201 | $19,799 |
| 2024 | $5,981 | $26,001 | $5,168 | $20,833 |
| 2023 | $5,810 | $26,001 | $5,168 | $20,833 |
| 2022 | $5,810 | $26,001 | $5,168 | $20,833 |
| 2021 | $5,102 | $19,927 | $4,306 | $15,621 |
| 2020 | $5,084 | $19,927 | $4,306 | $15,621 |
| 2019 | $5,103 | $22,390 | $4,306 | $18,084 |
| 2018 | $4,898 | $19,814 | $3,789 | $16,025 |
| 2017 | $4,829 | $19,814 | $3,789 | $16,025 |
| 2016 | $4,812 | $19,814 | $3,789 | $16,025 |
| 2015 | $3,907 | $15,546 | $3,272 | $12,274 |
| 2014 | $3,841 | $15,546 | $3,272 | $12,274 |
| 2013 | $3,727 | $15,546 | $3,272 | $12,274 |
Source: Public Records
Map
Nearby Homes
- 1162 W Grant Dr
- 674 E Algonquin Rd
- 1205 S Wolf Rd
- 980 W Grant Dr
- 1394 Carol Ln
- 1122 Alfini Dr
- 505 Forest Ave
- 886 E Thacker St
- 664 E Oakton St
- 1080 Bogart St
- 815 E Oakton St Unit 311
- 652 E Prairie Ave
- 1596 Oxford Rd
- 1107 E Prairie Ave
- 584 S 4th Ave
- 508 Crestwood Dr
- 1380 Oakwood Ave Unit 306
- 556 Orchard Ct
- 799 Graceland Ave Unit 404A
- 900 Center St Unit 3A
- 752 E Algonquin Rd
- 736 E Algonquin Rd
- 758 E Algonquin Rd
- 728 E Algonquin Rd
- 1165 Southwest Place
- 1160 W Grant Dr
- 1156 W Grant Dr
- 766 E Algonquin Rd
- 722 E Algonquin Rd
- 1154 W Grant Dr
- 774 E Algonquin Rd
- 710 E Algonquin Rd
- 1164 W Grant Dr
- 1148 W Grant Dr
- 1159 Southwest Place
- 782 E Algonquin Rd
- 1166 W Grant Dr
- 1142 W Grant Dr
- 792 E Algonquin Rd
- 1168 W Grant Dr
Your Personal Tour Guide
Ask me questions while you tour the home.