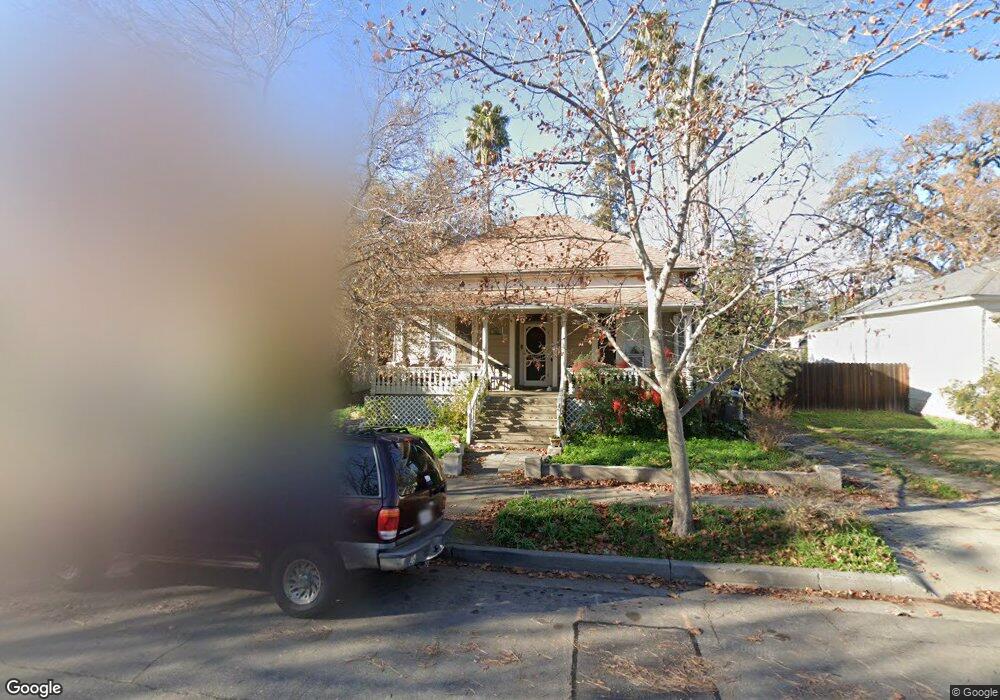
742 Elm St Woodland, CA 95695
Estimated Value: $168,000 - $521,000
2
Beds
1
Bath
1,318
Sq Ft
$300/Sq Ft
Est. Value
About This Home
This home is located at 742 Elm St, Woodland, CA 95695 and is currently estimated at $395,502, approximately $300 per square foot. 742 Elm St is a home located in Yolo County with nearby schools including Dingle Elementary School, Lee Middle School, and Woodland Senior High School.
Ownership History
Date
Name
Owned For
Owner Type
Purchase Details
Closed on
Aug 30, 2010
Sold by
Nardini Robin E
Bought by
Cox Jon and Kinsella Joyce
Current Estimated Value
Purchase Details
Closed on
Apr 12, 2007
Sold by
Duncan David
Bought by
Nardini Robin E
Home Financials for this Owner
Home Financials are based on the most recent Mortgage that was taken out on this home.
Original Mortgage
$200,000
Interest Rate
8.95%
Mortgage Type
Purchase Money Mortgage
Create a Home Valuation Report for This Property
The Home Valuation Report is an in-depth analysis detailing your home's value as well as a comparison with similar homes in the area
Home Values in the Area
Average Home Value in this Area
Purchase History
| Date | Buyer | Sale Price | Title Company |
|---|---|---|---|
| Cox Jon | $145,000 | Fidelity Natl Title Co Of Ca | |
| Nardini Robin E | -- | Financial Title Company |
Source: Public Records
Mortgage History
| Date | Status | Borrower | Loan Amount |
|---|---|---|---|
| Previous Owner | Nardini Robin E | $200,000 |
Source: Public Records
Tax History Compared to Growth
Tax History
| Year | Tax Paid | Tax Assessment Tax Assessment Total Assessment is a certain percentage of the fair market value that is determined by local assessors to be the total taxable value of land and additions on the property. | Land | Improvement |
|---|---|---|---|---|
| 2025 | $2,490 | $185,757 | $89,675 | $96,082 |
| 2023 | $2,490 | $178,546 | $86,194 | $92,352 |
| 2022 | $1,840 | $175,046 | $84,504 | $90,542 |
| 2021 | $1,811 | $171,615 | $82,848 | $88,767 |
| 2020 | $1,785 | $169,856 | $81,999 | $87,857 |
| 2019 | $1,751 | $166,527 | $80,392 | $86,135 |
| 2018 | $1,734 | $163,263 | $78,816 | $84,447 |
| 2017 | $1,696 | $160,063 | $77,271 | $82,792 |
| 2016 | $1,667 | $156,925 | $75,756 | $81,169 |
| 2015 | $1,612 | $154,569 | $74,619 | $79,950 |
| 2014 | $1,612 | $151,542 | $73,158 | $78,384 |
Source: Public Records
Map
Nearby Homes