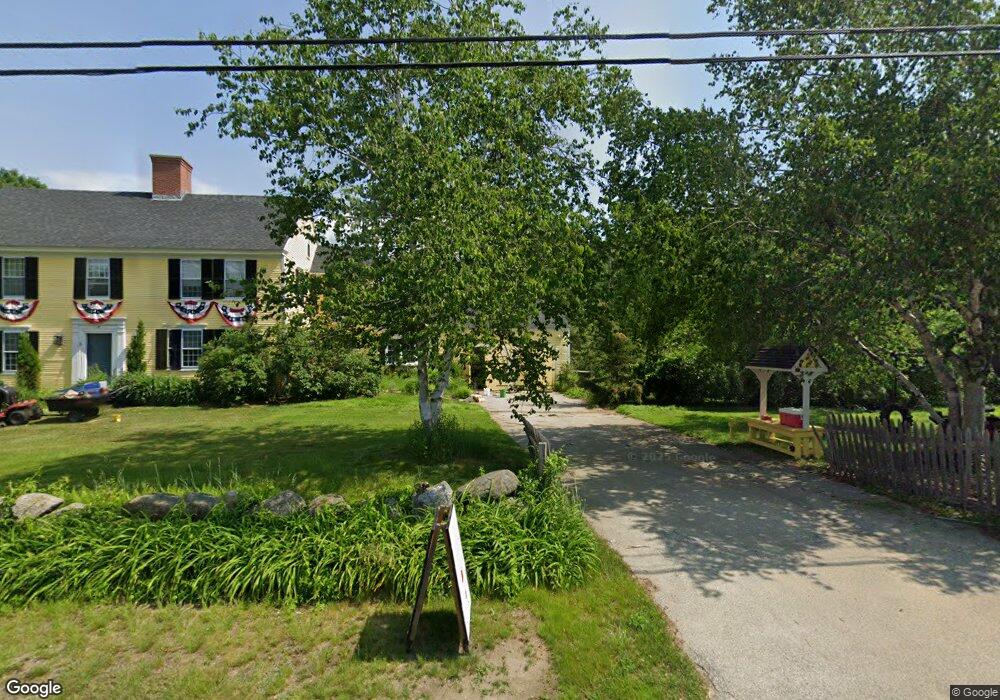
742 Forest Rd Greenfield, NH 03047
Estimated Value: $628,000 - $701,000
5
Beds
2
Baths
3,676
Sq Ft
$181/Sq Ft
Est. Value
About This Home
This home is located at 742 Forest Rd, Greenfield, NH 03047 and is currently estimated at $664,449, approximately $180 per square foot. 742 Forest Rd is a home located in Hillsborough County with nearby schools including Greenfield Elementary School, South Meadow School, and Conval Regional High School.
Ownership History
Date
Name
Owned For
Owner Type
Purchase Details
Closed on
Sep 16, 2010
Sold by
Fnma
Bought by
Finn Kenneth C and Finn Lori L
Current Estimated Value
Home Financials for this Owner
Home Financials are based on the most recent Mortgage that was taken out on this home.
Original Mortgage
$147,920
Outstanding Balance
$96,486
Interest Rate
4.51%
Mortgage Type
Purchase Money Mortgage
Estimated Equity
$567,963
Purchase Details
Closed on
Jun 30, 2010
Sold by
Hull Gerald B
Bought by
Federal National Mortgage Association
Create a Home Valuation Report for This Property
The Home Valuation Report is an in-depth analysis detailing your home's value as well as a comparison with similar homes in the area
Home Values in the Area
Average Home Value in this Area
Purchase History
| Date | Buyer | Sale Price | Title Company |
|---|---|---|---|
| Finn Kenneth C | $184,900 | -- | |
| Federal National Mortgage Association | $227,600 | -- |
Source: Public Records
Mortgage History
| Date | Status | Borrower | Loan Amount |
|---|---|---|---|
| Open | Federal National Mortgage Association | $147,920 |
Source: Public Records
Tax History
| Year | Tax Paid | Tax Assessment Tax Assessment Total Assessment is a certain percentage of the fair market value that is determined by local assessors to be the total taxable value of land and additions on the property. | Land | Improvement |
|---|---|---|---|---|
| 2025 | $14,314 | $681,600 | $140,600 | $541,000 |
| 2024 | $14,845 | $667,200 | $140,600 | $526,600 |
| 2023 | $11,980 | $353,400 | $80,600 | $272,800 |
| 2022 | $10,750 | $353,400 | $80,600 | $272,800 |
| 2021 | $9,377 | $349,900 | $80,600 | $269,300 |
| 2020 | $9,386 | $345,700 | $80,600 | $265,100 |
| 2019 | $9,427 | $345,700 | $80,600 | $265,100 |
| 2018 | $9,360 | $304,700 | $64,400 | $240,300 |
| 2017 | $8,928 | $297,900 | $64,400 | $233,500 |
| 2016 | $8,410 | $297,900 | $64,400 | $233,500 |
| 2015 | $8,606 | $310,000 | $64,400 | $245,600 |
| 2014 | $8,255 | $310,000 | $64,400 | $245,600 |
| 2013 | $8,475 | $348,900 | $81,800 | $267,100 |
Source: Public Records
Map
Nearby Homes
Your Personal Tour Guide
Ask me questions while you tour the home.