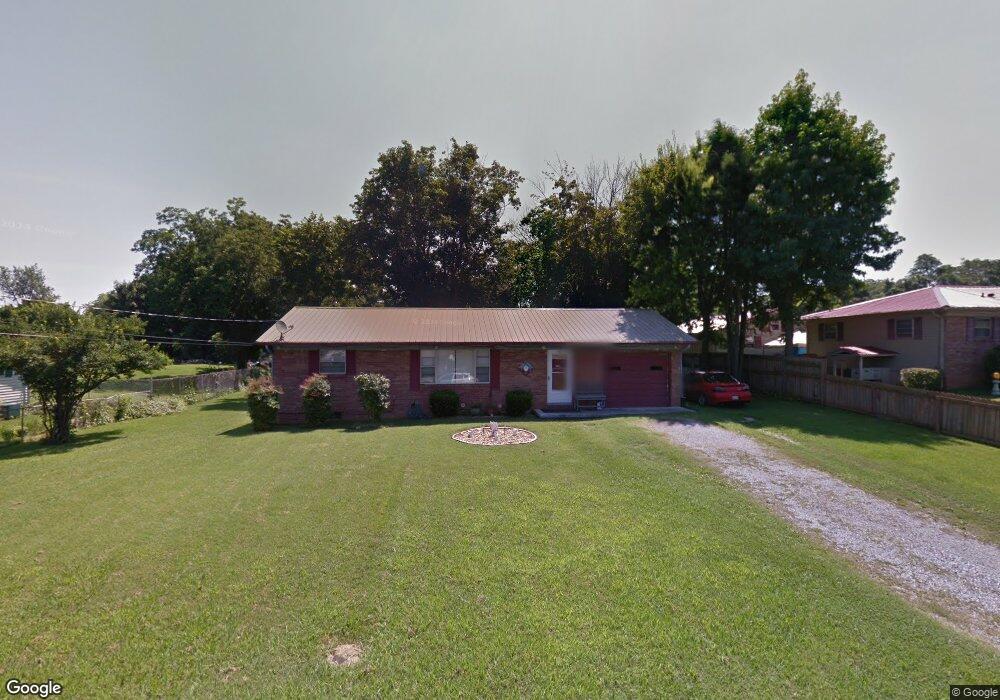
742 Fulton Rd Morristown, TN 37814
Estimated Value: $135,000 - $208,000
--
Bed
1
Bath
1,040
Sq Ft
$165/Sq Ft
Est. Value
About This Home
This home is located at 742 Fulton Rd, Morristown, TN 37814 and is currently estimated at $171,231, approximately $164 per square foot. 742 Fulton Rd is a home located in Hamblen County with nearby schools including John Hay Elementary School, Meadowview Middle School, and Morristown East High School.
Ownership History
Date
Name
Owned For
Owner Type
Purchase Details
Closed on
Sep 16, 2005
Bought by
Villeda Phyllis and Villeda Fausto
Current Estimated Value
Home Financials for this Owner
Home Financials are based on the most recent Mortgage that was taken out on this home.
Original Mortgage
$70,000
Outstanding Balance
$37,262
Interest Rate
5.77%
Estimated Equity
$133,969
Purchase Details
Closed on
Jun 7, 2004
Sold by
Pencosky Sylvia J
Bought by
Villeda Phyllis
Home Financials for this Owner
Home Financials are based on the most recent Mortgage that was taken out on this home.
Original Mortgage
$48,800
Interest Rate
10%
Purchase Details
Closed on
Jun 14, 2000
Sold by
Pencosky Sylvia Jean
Bought by
Pencosky John A
Purchase Details
Closed on
Nov 4, 1993
Bought by
Perkey Ethel D L and %Sylvia Jean Pencosky E
Purchase Details
Closed on
Mar 28, 1985
Bought by
Perkey William Fred and Perkey Ethel D
Create a Home Valuation Report for This Property
The Home Valuation Report is an in-depth analysis detailing your home's value as well as a comparison with similar homes in the area
Home Values in the Area
Average Home Value in this Area
Purchase History
| Date | Buyer | Sale Price | Title Company |
|---|---|---|---|
| Villeda Phyllis | -- | -- | |
| Villeda Phyllis | $61,000 | -- | |
| Pencosky John A | -- | -- | |
| Perkey Ethel D L | $35,000 | -- | |
| Perkey William Fred | $27,000 | -- |
Source: Public Records
Mortgage History
| Date | Status | Borrower | Loan Amount |
|---|---|---|---|
| Open | Perkey William Fred | $70,000 | |
| Previous Owner | Perkey William Fred | $48,800 | |
| Previous Owner | Perkey William Fred | $12,200 |
Source: Public Records
Tax History Compared to Growth
Tax History
| Year | Tax Paid | Tax Assessment Tax Assessment Total Assessment is a certain percentage of the fair market value that is determined by local assessors to be the total taxable value of land and additions on the property. | Land | Improvement |
|---|---|---|---|---|
| 2024 | $373 | $21,200 | $4,675 | $16,525 |
| 2023 | $373 | $21,200 | $0 | $0 |
| 2022 | $670 | $21,200 | $4,675 | $16,525 |
| 2021 | $670 | $21,200 | $4,675 | $16,525 |
| 2020 | $669 | $21,200 | $4,675 | $16,525 |
| 2019 | $610 | $17,950 | $4,375 | $13,575 |
| 2018 | $565 | $17,950 | $4,375 | $13,575 |
| 2017 | $556 | $17,950 | $4,375 | $13,575 |
| 2016 | $531 | $17,950 | $4,375 | $13,575 |
| 2015 | $494 | $17,950 | $4,375 | $13,575 |
| 2014 | -- | $17,950 | $4,375 | $13,575 |
| 2013 | -- | $18,975 | $0 | $0 |
Source: Public Records
Map
Nearby Homes
- 0 Morelock Rd N
- 1250 N Liberty Hill Rd
- 2405 Southern Dr
- 2320 Southern Dr
- 345 Belle Meade Cir
- 1643 Meadowview Ln
- 1635 Meadowview Ln
- Lot 2 Morelock Rd
- 1250 N Liberty Hill Dr
- 3003 Eloise Dr
- 3115 Eloise Dr
- 512 Cliff St
- 2035 Reese St
- 2021 Arnold Ave
- 517 Cliff St
- 3113 Berna Way
- 1710 Morningside Dr
- 2998 Nicole Cir
- 3004 Nicole Cir
- 1683 Pebblestone Ct