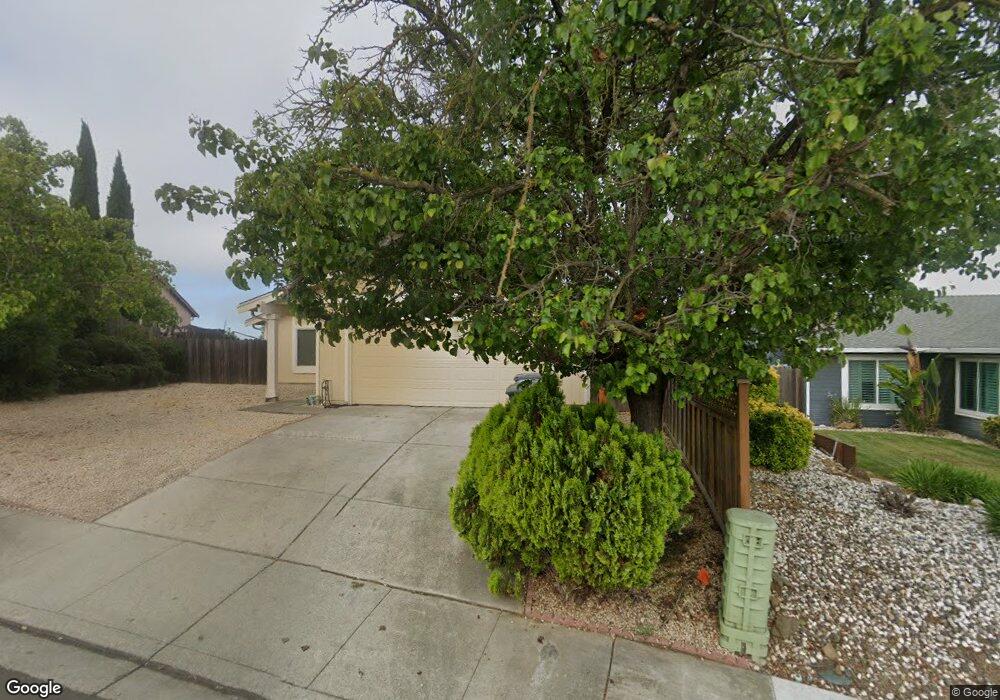
742 La Canyada Dr Vallejo, CA 94591
South Vallejo NeighborhoodEstimated Value: $407,000 - $486,000
3
Beds
2
Baths
1,156
Sq Ft
$389/Sq Ft
Est. Value
About This Home
This home is located at 742 La Canyada Dr, Vallejo, CA 94591 and is currently estimated at $449,403, approximately $388 per square foot. 742 La Canyada Dr is a home located in Solano County with nearby schools including Glen Cove Elementary, Jesse M. Bethel High School, and St. Patrick-St. Vincent High School.
Ownership History
Date
Name
Owned For
Owner Type
Purchase Details
Closed on
Dec 28, 2016
Sold by
Tan Hui Xiu
Bought by
Tan Hui Xiu
Current Estimated Value
Purchase Details
Closed on
Nov 20, 2010
Sold by
Xu Jia Jian
Bought by
Tan Hui Xiu
Purchase Details
Closed on
Nov 10, 2010
Sold by
Wells Fargo Bank Na
Bought by
Tan Hui Xiu
Purchase Details
Closed on
Sep 9, 2010
Sold by
Everett Sheri D
Bought by
Wells Fargo Bank Na
Purchase Details
Closed on
Aug 6, 1999
Sold by
Hud
Bought by
Everett Sheri D
Home Financials for this Owner
Home Financials are based on the most recent Mortgage that was taken out on this home.
Original Mortgage
$122,312
Interest Rate
7.7%
Mortgage Type
FHA
Purchase Details
Closed on
Feb 8, 1999
Sold by
Midfirst Bank
Bought by
Hud
Purchase Details
Closed on
Dec 10, 1998
Sold by
Berger Harold D and Berger Nellie J
Bought by
Midfirst Bank
Create a Home Valuation Report for This Property
The Home Valuation Report is an in-depth analysis detailing your home's value as well as a comparison with similar homes in the area
Home Values in the Area
Average Home Value in this Area
Purchase History
| Date | Buyer | Sale Price | Title Company |
|---|---|---|---|
| Tan Hui Xiu | -- | None Available | |
| Tan Hui Xiu | -- | Fidelity National Title Co | |
| Tan Hui Xiu | $130,000 | Fidelity National Title Co | |
| Wells Fargo Bank Na | $108,459 | Accommodation | |
| Everett Sheri D | $122,500 | North American Title Co | |
| Hud | -- | American Title | |
| Midfirst Bank | $101,577 | American Title Co |
Source: Public Records
Mortgage History
| Date | Status | Borrower | Loan Amount |
|---|---|---|---|
| Previous Owner | Everett Sheri D | $122,312 | |
| Closed | Everett Sheri D | $5,500 |
Source: Public Records
Tax History Compared to Growth
Tax History
| Year | Tax Paid | Tax Assessment Tax Assessment Total Assessment is a certain percentage of the fair market value that is determined by local assessors to be the total taxable value of land and additions on the property. | Land | Improvement |
|---|---|---|---|---|
| 2025 | $2,976 | $166,541 | $38,431 | $128,110 |
| 2024 | $2,976 | $163,277 | $37,678 | $125,599 |
| 2023 | $2,772 | $160,077 | $36,940 | $123,137 |
| 2022 | $2,667 | $156,939 | $36,216 | $120,723 |
| 2021 | $2,606 | $153,862 | $35,506 | $118,356 |
| 2020 | $2,602 | $152,285 | $35,142 | $117,143 |
| 2019 | $2,508 | $149,300 | $34,453 | $114,847 |
| 2018 | $2,337 | $146,374 | $33,778 | $112,596 |
| 2017 | $2,218 | $143,505 | $33,116 | $110,389 |
| 2016 | $1,648 | $140,692 | $32,467 | $108,225 |
| 2015 | $1,627 | $138,580 | $31,980 | $106,600 |
| 2014 | $1,604 | $135,866 | $31,354 | $104,512 |
Source: Public Records
Map
Nearby Homes
- 173 Jordan St
- 227 Clearpointe Dr
- 247 Clearpointe Dr
- 1401 Magazine St
- 1406 Magazine St
- 118 Outrigger Dr
- 121 La Brea St
- 126 Jordan St
- 65 Beverly Dr
- 154 Outrigger Dr
- 2 Jordan St
- 7 La Paz St
- 15 Constance Dr
- 1401 Coronel Ave
- 207 Wilshire Ave
- 175 Frieda Cir
- 908 Santa Felipo Ct
- 954 Grant St
- 904 Santa Lori Ct
- 113 Laguna St
- 748 La Canyada Dr
- 736 La Canyada Dr
- 754 La Canyada Dr
- 730 La Canyada Dr
- 733 La Canyada Dr
- 760 La Canyada Dr
- 724 La Canyada Dr
- 224 Pueblo Way
- 232 Pueblo Way
- 719 La Canyada Dr
- 216 Pueblo Way
- 745 La Canyada Dr
- 240 Pueblo Way
- 208 Pueblo Way
- 766 La Canyada Dr
- 751 La Canyada Dr
- 718 La Canyada Dr
- 248 Pueblo Way
- 707 La Canyada Dr
- 200 Pueblo Way