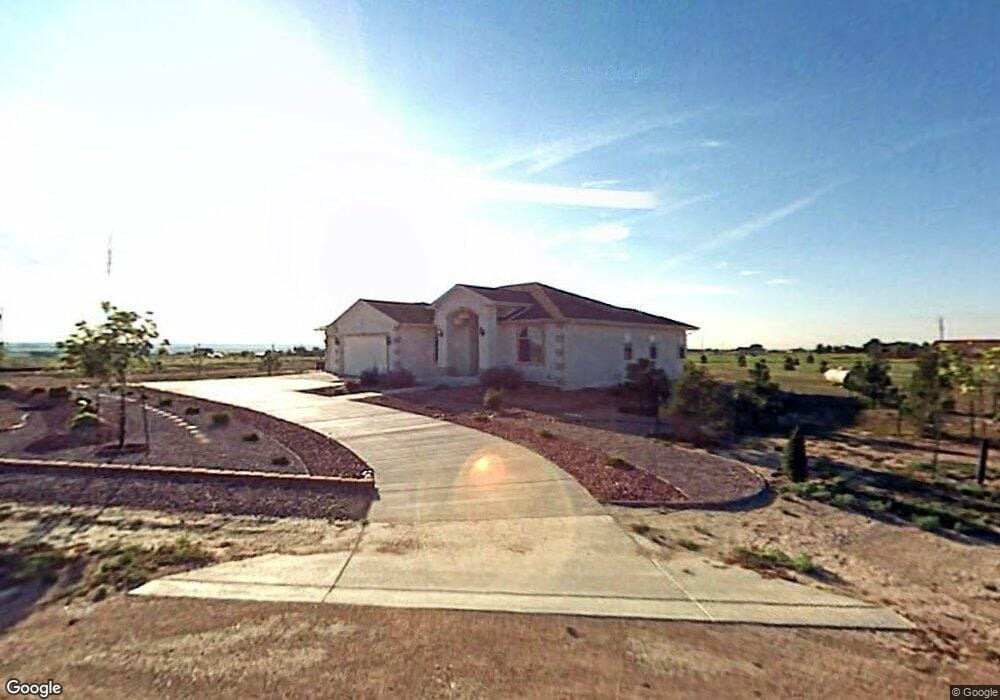
742 N Hale Dr Pueblo, CO 81007
Estimated Value: $436,000 - $573,000
4
Beds
3
Baths
4,076
Sq Ft
$125/Sq Ft
Est. Value
About This Home
This home is located at 742 N Hale Dr, Pueblo, CO 81007 and is currently estimated at $509,629, approximately $125 per square foot. 742 N Hale Dr is a home located in Pueblo County with nearby schools including Prairie Winds Elementary School, Liberty Point International School, and Pueblo West High School.
Ownership History
Date
Name
Owned For
Owner Type
Purchase Details
Closed on
May 31, 2017
Sold by
Trani Travis and Parra Caroline J
Bought by
Burtlow Shawn and Burtlow Siobhan
Current Estimated Value
Home Financials for this Owner
Home Financials are based on the most recent Mortgage that was taken out on this home.
Original Mortgage
$334,541
Outstanding Balance
$277,886
Interest Rate
3.97%
Mortgage Type
VA
Estimated Equity
$231,743
Purchase Details
Closed on
Aug 6, 2010
Sold by
Howell Franklin D and Howell Gennelle C
Bought by
Trani Travis and Parra Caroline J
Home Financials for this Owner
Home Financials are based on the most recent Mortgage that was taken out on this home.
Original Mortgage
$317,300
Interest Rate
4.69%
Mortgage Type
New Conventional
Purchase Details
Closed on
Oct 15, 2005
Sold by
Clark Construction Inc
Bought by
Howell Franklin D and Howell Gennelle C
Create a Home Valuation Report for This Property
The Home Valuation Report is an in-depth analysis detailing your home's value as well as a comparison with similar homes in the area
Home Values in the Area
Average Home Value in this Area
Purchase History
| Date | Buyer | Sale Price | Title Company |
|---|---|---|---|
| Burtlow Shawn | $327,500 | Stewart Title | |
| Trani Travis | $334,000 | Stewart Title | |
| Howell Franklin D | $309,863 | Stewart Title Of Pueblo |
Source: Public Records
Mortgage History
| Date | Status | Borrower | Loan Amount |
|---|---|---|---|
| Open | Burtlow Shawn | $334,541 | |
| Previous Owner | Trani Travis | $317,300 |
Source: Public Records
Tax History Compared to Growth
Tax History
| Year | Tax Paid | Tax Assessment Tax Assessment Total Assessment is a certain percentage of the fair market value that is determined by local assessors to be the total taxable value of land and additions on the property. | Land | Improvement |
|---|---|---|---|---|
| 2024 | $3,356 | $33,470 | -- | -- |
| 2023 | $3,395 | $37,150 | $3,580 | $33,570 |
| 2022 | $3,113 | $31,020 | $2,330 | $28,690 |
| 2021 | $3,191 | $31,920 | $2,400 | $29,520 |
| 2020 | $2,624 | $31,920 | $2,400 | $29,520 |
| 2019 | $2,617 | $26,182 | $965 | $25,217 |
| 2018 | $2,209 | $22,093 | $540 | $21,553 |
| 2017 | $2,212 | $22,093 | $540 | $21,553 |
| 2016 | $2,119 | $21,202 | $637 | $20,565 |
| 2015 | $2,101 | $21,202 | $637 | $20,565 |
| 2014 | $971 | $19,573 | $756 | $18,817 |
Source: Public Records
Map
Nearby Homes
- 1309 E Jaroso Dr
- 902 E Platteville Blvd
- 869 E Platteville Blvd
- 292 N Purcell Blvd
- 803 N Ravencliff Dr
- 574 N Canvas Dr
- 1045 E Jaroso Dr
- 977 E Sumac Dr
- 923 E Platteville Blvd
- 633 N Iliff Dr
- 1358 E Kiva Dr
- 562 N Mancos Dr
- 806 N Monarch Dr
- 1174 E Escondido Dr
- 688 Maplelawn Dr
- 1370 Kiva Dr
- 546 N Mancos Dr
- 1394 E Kiva Dr
- 729 Mapleleaf Dr
- 893 E Platteville Blvd
- 734 N Hale Dr
- 734 N Hale Dr Unit 5
- 737 N Hale Dr
- 737 N Hale Dr Unit 5
- 720 N Hale Dr Unit 6
- 745 N Hale Dr Unit 6
- 729 N Hale Dr
- 935 E Jaroso Dr Unit 23
- 1091 E Jaroso Dr Unit 28
- 1279 E Jaroso Dr
- 902 E Jaroso Dr
- 721 N Hale Dr Unit 3
- 721 N Hale Dr
- 1163 E Jaroso Dr
- 769 N Hale Dr Unit 1
- 1178 E Jaroso Dr Unit 3
- 1178 E Jaroso Dr
- 713 N Hale Dr
- 1151 E Jaroso Dr
- 1151 E Jaroso Dr Unit 2