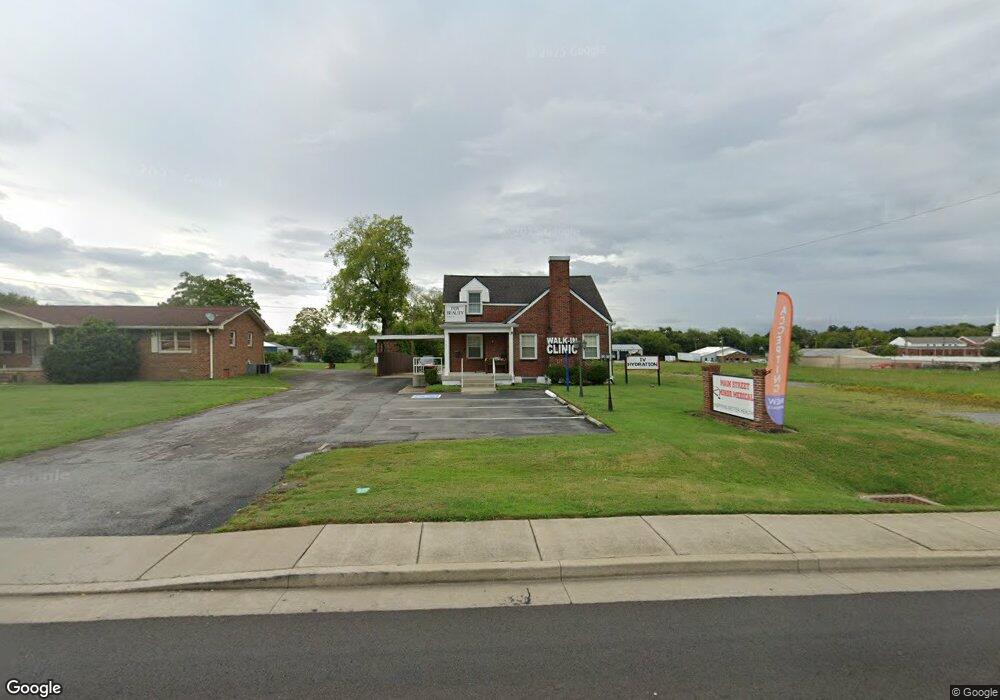
742 N Main St Shelbyville, TN 37160
Estimated Value: $346,417 - $463,000
--
Bed
3
Baths
1,855
Sq Ft
$211/Sq Ft
Est. Value
About This Home
This home is located at 742 N Main St, Shelbyville, TN 37160 and is currently estimated at $392,104, approximately $211 per square foot. 742 N Main St is a home located in Bedford County with nearby schools including Harris Middle School, Victory Baptist Academy, and Christian Chapel Academy.
Ownership History
Date
Name
Owned For
Owner Type
Purchase Details
Closed on
Dec 1, 2023
Sold by
James Dietzen Bratcher Jr Revocable Livi
Bought by
Fox Medical Group Llc
Current Estimated Value
Home Financials for this Owner
Home Financials are based on the most recent Mortgage that was taken out on this home.
Original Mortgage
$350,000
Outstanding Balance
$344,045
Interest Rate
7.63%
Mortgage Type
New Conventional
Estimated Equity
$48,059
Purchase Details
Closed on
Feb 4, 2019
Sold by
Bobo Richard and Bobo Suzanne
Bought by
Bratcher James Dietzen and The James Dietzen Bratcher Jr Revoca
Purchase Details
Closed on
Jan 23, 2006
Sold by
Robinson Ruby Gentry
Bought by
Bobo Richard
Purchase Details
Closed on
Oct 14, 1988
Bought by
Robinson Ruby Gentry Le and Robinson Bette R
Purchase Details
Closed on
Apr 21, 1966
Bought by
Robinson Ruby Gentry
Purchase Details
Closed on
Feb 6, 1940
Create a Home Valuation Report for This Property
The Home Valuation Report is an in-depth analysis detailing your home's value as well as a comparison with similar homes in the area
Home Values in the Area
Average Home Value in this Area
Purchase History
| Date | Buyer | Sale Price | Title Company |
|---|---|---|---|
| Fox Medical Group Llc | $450,000 | None Listed On Document | |
| Bratcher James Dietzen | $200,000 | None Available | |
| Bobo Richard | $140,000 | -- | |
| Robinson Ruby Gentry Le | $37,900 | -- | |
| Robinson Ruby Gentry | -- | -- | |
| -- | -- | -- |
Source: Public Records
Mortgage History
| Date | Status | Borrower | Loan Amount |
|---|---|---|---|
| Open | Fox Medical Group Llc | $350,000 |
Source: Public Records
Tax History Compared to Growth
Tax History
| Year | Tax Paid | Tax Assessment Tax Assessment Total Assessment is a certain percentage of the fair market value that is determined by local assessors to be the total taxable value of land and additions on the property. | Land | Improvement |
|---|---|---|---|---|
| 2025 | -- | $99,040 | $0 | $0 |
| 2024 | -- | $99,040 | $52,200 | $46,840 |
| 2023 | $3,769 | $99,040 | $52,200 | $46,840 |
| 2022 | $3,878 | $99,040 | $52,200 | $46,840 |
| 2021 | $3,521 | $99,040 | $52,200 | $46,840 |
| 2020 | $2,623 | $99,040 | $52,200 | $46,840 |
| 2019 | $2,623 | $59,200 | $53,400 | $5,800 |
| 2018 | $2,564 | $59,200 | $53,400 | $5,800 |
| 2017 | $2,564 | $59,200 | $53,400 | $5,800 |
| 2016 | $2,540 | $59,200 | $53,400 | $5,800 |
| 2015 | $2,540 | $59,200 | $53,400 | $5,800 |
| 2014 | $2,204 | $56,229 | $0 | $0 |
Source: Public Records
Map
Nearby Homes
- 0 Hilltop Rd Unit RTC2897754
- 0 Hilltop Rd Unit RTC3001632
- 112 E Cedar St
- 703 Deery St
- 636 Deery St
- 724 Alton Ave
- 1000 Woodbury St
- 527 Deery St
- 713 King Ave
- 714 King Ave
- 1017 Fairfield Pike
- 102 Saddlewood Dr
- 115 Scotland Heights
- 610 Sundance St
- 216 Celebration St
- 178 Lucas Rd
- 464 Whitthorne St
- 129 Annas Way
- 134 Butler St
- 0 E Depot St
- 738 N Main St
- 734 N Main St
- 752 N Main St
- 0 Hilltop Rd Unit RTC2763385
- 0 Hilltop Rd Unit RTC2760922
- 0 Hilltop Rd Unit RTC2655585
- 0 Hilltop Rd Unit RTC2640699
- 0 Hilltop Rd
- 745 N Main St
- 747 N Main St
- 730 N Main St
- 756 N Main St
- 739 N Main St
- 727 N Main St
- 760 N Main St
- 725 N Main St
- 811 N Jefferson St
- 109 Noblitt St
- 768 N Main St
- 719 N Main St