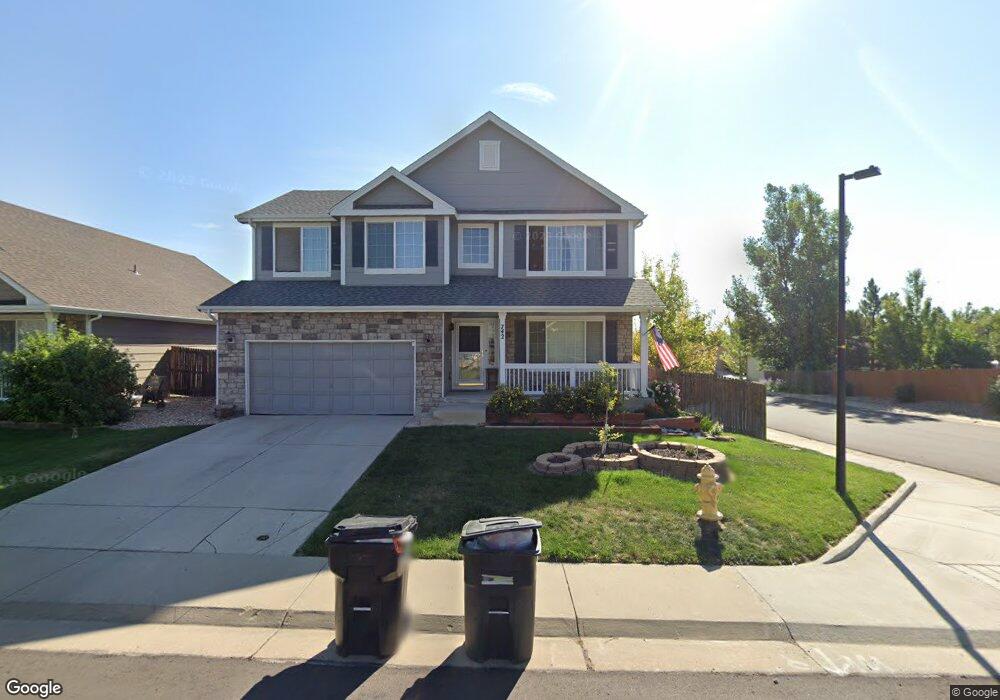
742 Pitkin Way Castle Rock, CO 80104
Founders Village NeighborhoodEstimated Value: $629,000 - $661,000
4
Beds
3
Baths
4,108
Sq Ft
$156/Sq Ft
Est. Value
About This Home
This home is located at 742 Pitkin Way, Castle Rock, CO 80104 and is currently estimated at $641,048, approximately $156 per square foot. 742 Pitkin Way is a home located in Douglas County with nearby schools including Rock Ridge Elementary School, Mesa Middle School, and Douglas County High School.
Ownership History
Date
Name
Owned For
Owner Type
Purchase Details
Closed on
Nov 10, 2017
Sold by
Sargenti Victor Joseph and Sargenti Lisa M
Bought by
Rutigliano Samuel R and Rutigliano Chrystal J
Current Estimated Value
Home Financials for this Owner
Home Financials are based on the most recent Mortgage that was taken out on this home.
Original Mortgage
$331,920
Outstanding Balance
$277,986
Interest Rate
3.83%
Mortgage Type
New Conventional
Estimated Equity
$363,062
Purchase Details
Closed on
Jan 16, 2003
Sold by
Sargenti Victor Joseph
Bought by
Sargenti Victor Joseph and Sargenti Lisa M
Home Financials for this Owner
Home Financials are based on the most recent Mortgage that was taken out on this home.
Original Mortgage
$247,500
Interest Rate
6.15%
Purchase Details
Closed on
Jan 31, 2001
Sold by
Engle Homes Colorado Inc
Bought by
Sargenti Victor Joseph
Home Financials for this Owner
Home Financials are based on the most recent Mortgage that was taken out on this home.
Original Mortgage
$200,550
Interest Rate
7.13%
Create a Home Valuation Report for This Property
The Home Valuation Report is an in-depth analysis detailing your home's value as well as a comparison with similar homes in the area
Home Values in the Area
Average Home Value in this Area
Purchase History
| Date | Buyer | Sale Price | Title Company |
|---|---|---|---|
| Rutigliano Samuel R | $414,900 | Land Title Guarantee Co | |
| Sargenti Victor Joseph | -- | Chicago Title Co | |
| Sargenti Victor Joseph | $250,700 | Universal Land Title |
Source: Public Records
Mortgage History
| Date | Status | Borrower | Loan Amount |
|---|---|---|---|
| Open | Rutigliano Samuel R | $331,920 | |
| Previous Owner | Sargenti Victor Joseph | $247,500 | |
| Previous Owner | Sargenti Victor Joseph | $200,550 |
Source: Public Records
Tax History Compared to Growth
Tax History
| Year | Tax Paid | Tax Assessment Tax Assessment Total Assessment is a certain percentage of the fair market value that is determined by local assessors to be the total taxable value of land and additions on the property. | Land | Improvement |
|---|---|---|---|---|
| 2024 | $7,372 | $48,570 | $8,680 | $39,890 |
| 2023 | $7,416 | $48,570 | $8,680 | $39,890 |
| 2022 | $5,255 | $33,190 | $6,380 | $26,810 |
| 2021 | $5,352 | $33,190 | $6,380 | $26,810 |
| 2020 | $4,807 | $30,680 | $5,420 | $25,260 |
| 2019 | $4,809 | $30,680 | $5,420 | $25,260 |
| 2018 | $4,211 | $26,660 | $4,180 | $22,480 |
| 2017 | $4,053 | $26,660 | $4,180 | $22,480 |
| 2016 | $3,566 | $24,490 | $4,020 | $20,470 |
| 2015 | $3,612 | $24,490 | $4,020 | $20,470 |
| 2014 | $3,100 | $20,180 | $3,420 | $16,760 |
Source: Public Records
Map
Nearby Homes
- 596 S Lindsey St
- 510 Fairhaven St
- 576 S Lindsey St
- 5133 E Essex Ave
- NA Ridge Rd
- 1005 Parsons Ave
- 1025 S Lindsey St
- 4947 Stoneham Ave
- 5181 Devon Ave
- 4937 Parsons Way
- 5282 Devon Ave
- 4590 Wakefield Ave
- 378 Benton St
- 4864 Parsons Way
- 321 Lockwood St
- 1243 Parsons Ave
- 149 S Pembrook St
- 176 S Pembrook St
- 5428 Suffolk Ave
- 4372 E Andover Ave
- 726 Pitkin Way
- 741 Fairhaven St
- 770 Pitkin Way
- 698 Pitkin Way
- 744 Hampstead Ave
- 773 Fairhaven St
- 697 Fairhaven St
- 780 Pitkin Way
- 699 Pitkin Way
- 773 Pitkin Way
- 789 Fairhaven St
- 675 Fairhaven St
- 728 Hampstead Ave
- 808 Pitkin Way
- 671 Pitkin Way
- 654 Pitkin Way
- 791 Pitkin Way
- 848 Bartlett St
- 821 Fairhaven St
- 736 Fairhaven St