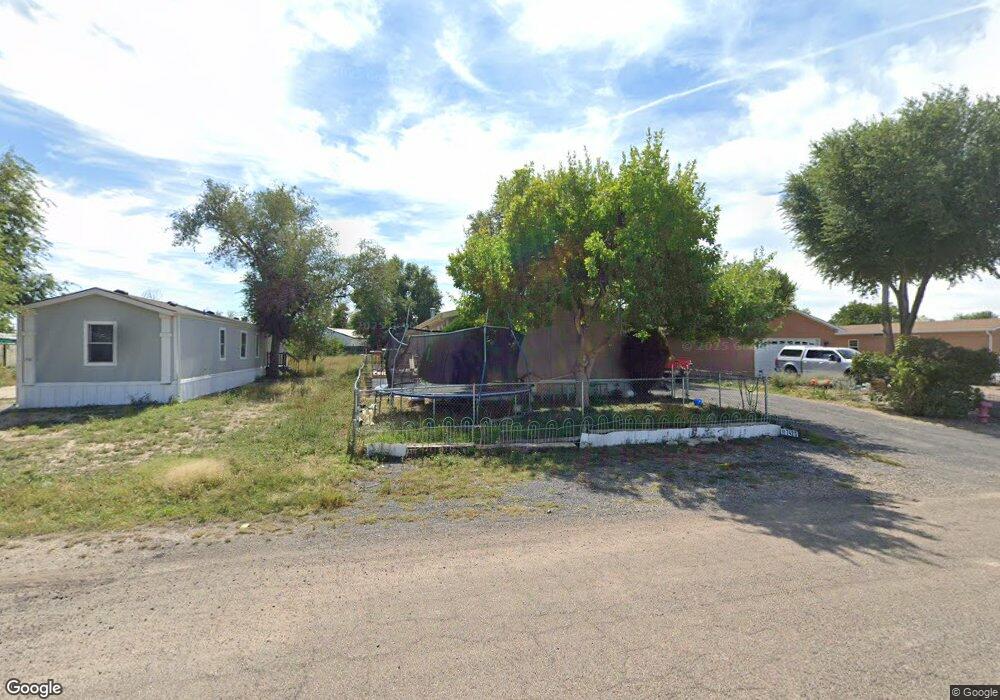
742 S Joe Martinez Ct Pueblo, CO 81007
Estimated Value: $204,723 - $299,000
5
Beds
2
Baths
2,128
Sq Ft
$115/Sq Ft
Est. Value
About This Home
This home is located at 742 S Joe Martinez Ct, Pueblo, CO 81007 and is currently estimated at $243,931, approximately $114 per square foot. 742 S Joe Martinez Ct is a home located in Pueblo County with nearby schools including Liberty Point Elementary School, Liberty Point International School, and Pueblo West High School.
Ownership History
Date
Name
Owned For
Owner Type
Purchase Details
Closed on
Dec 16, 2016
Sold by
Maxson Mary G
Bought by
Bailey Angelia A
Current Estimated Value
Home Financials for this Owner
Home Financials are based on the most recent Mortgage that was taken out on this home.
Original Mortgage
$101,134
Outstanding Balance
$81,714
Interest Rate
3.54%
Mortgage Type
FHA
Estimated Equity
$162,217
Purchase Details
Closed on
May 17, 1993
Sold by
Real C Ernest
Bought by
Johnson Helen M
Purchase Details
Closed on
Oct 17, 1991
Sold by
Gavin Theresa A
Bought by
Real C Ernest
Purchase Details
Closed on
Sep 3, 1986
Sold by
Selig Ruth C + Randy S + Jame
Bought by
Gavin Theresa A
Purchase Details
Closed on
Jul 13, 1983
Bought by
Selig Ruth C + Randy S + Jame
Purchase Details
Closed on
Jul 3, 1974
Sold by
Selig Ruth C
Purchase Details
Closed on
Mar 20, 1973
Bought by
Selig Ruth C
Create a Home Valuation Report for This Property
The Home Valuation Report is an in-depth analysis detailing your home's value as well as a comparison with similar homes in the area
Home Values in the Area
Average Home Value in this Area
Purchase History
| Date | Buyer | Sale Price | Title Company |
|---|---|---|---|
| Bailey Angelia A | $103,000 | Stewart Title | |
| Johnson Helen M | $25,900 | -- | |
| Real C Ernest | $22,000 | -- | |
| Gavin Theresa A | $25,000 | -- | |
| Selig Ruth C + Randy S + Jame | -- | -- | |
| -- | -- | -- | |
| Selig Ruth C | -- | -- |
Source: Public Records
Mortgage History
| Date | Status | Borrower | Loan Amount |
|---|---|---|---|
| Open | Bailey Angelia A | $101,134 |
Source: Public Records
Tax History Compared to Growth
Tax History
| Year | Tax Paid | Tax Assessment Tax Assessment Total Assessment is a certain percentage of the fair market value that is determined by local assessors to be the total taxable value of land and additions on the property. | Land | Improvement |
|---|---|---|---|---|
| 2024 | $1,531 | $15,240 | -- | -- |
| 2023 | $1,549 | $18,920 | $1,840 | $17,080 |
| 2022 | $1,140 | $11,359 | $1,910 | $9,449 |
| 2021 | $1,169 | $11,690 | $1,970 | $9,720 |
| 2020 | $920 | $11,690 | $1,970 | $9,720 |
| 2019 | $917 | $9,174 | $965 | $8,209 |
| 2018 | $684 | $6,837 | $972 | $5,865 |
| 2017 | $684 | $6,837 | $972 | $5,865 |
| 2016 | $648 | $6,486 | $1,075 | $5,411 |
| 2015 | $643 | $6,486 | $1,075 | $5,411 |
| 2014 | $603 | $6,084 | $1,075 | $5,009 |
Source: Public Records
Map
Nearby Homes
- 63 E Vern Dr
- 715 S Joe Martinez Ln
- 714 S Walton Dr
- 169 E Bond Dr
- 664 S Dante Dr
- 782 S Mccoy Dr
- 243 E George Dr
- 128 E Byrd Dr
- 765 S Sterling Dr
- 629 S Aguilar Dr
- 108 E Kipling Dr
- 576 S Falcon Dr
- 281 E Stewart Dr
- 853 S Blakeland Dr
- 855 S Mccoy Dr
- 113 E Homer Dr
- 270 E Stewart Dr
- 880 S Dante Dr
- 892 S Kline Dr
- 825 S Tolstoi Dr
- 738 S Joe Martinez Ct
- 748 S Joe Martinez Ct
- 65 E Dante Ln
- 730 S Joe Martinez Ct
- 743 S Joe Martinez Ct
- 743 S Joe Martinez Ct Unit 70
- 61 E Dante Ln
- 73 E Dante Ln
- 57 E Dante Ln
- 57 E Dante Ln
- 751 S Joe Martinez Ln
- 77 E Dante Ln Unit 16
- 764 S Dante Dr
- 722 S Joe Martinez Ct
- 68 E Dante Ln
- 744 S Joe Martinez Ln
- 60 E Dante Ln
- 746 S Dante Dr
- 713 S Joe Martinez Ct
- 54 E Dante Ln