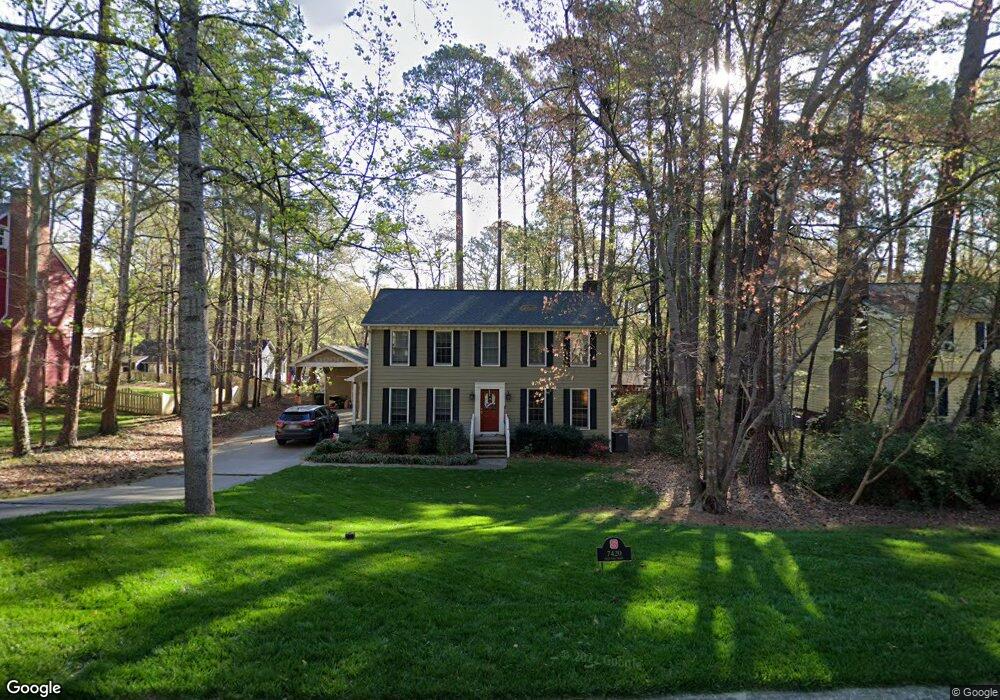
7420 Old Fox Trail Raleigh, NC 27613
Estimated Value: $525,000 - $554,000
4
Beds
3
Baths
2,040
Sq Ft
$264/Sq Ft
Est. Value
About This Home
This home is located at 7420 Old Fox Trail, Raleigh, NC 27613 and is currently estimated at $539,228, approximately $264 per square foot. 7420 Old Fox Trail is a home located in Wake County with nearby schools including Jeffreys Grove Elementary School, Carroll Middle, and Sanderson High School.
Ownership History
Date
Name
Owned For
Owner Type
Purchase Details
Closed on
May 14, 2019
Sold by
Jeffers David L and Jeffers Stephanie Z
Bought by
Whitby Caleb R and Rawls Mary L
Current Estimated Value
Home Financials for this Owner
Home Financials are based on the most recent Mortgage that was taken out on this home.
Original Mortgage
$310,400
Outstanding Balance
$271,790
Interest Rate
4%
Mortgage Type
New Conventional
Estimated Equity
$267,438
Purchase Details
Closed on
Mar 31, 2000
Sold by
Casey Charles Edward
Bought by
Jeffers David L and Jeffers Stephanie Z
Home Financials for this Owner
Home Financials are based on the most recent Mortgage that was taken out on this home.
Original Mortgage
$147,150
Interest Rate
7.62%
Create a Home Valuation Report for This Property
The Home Valuation Report is an in-depth analysis detailing your home's value as well as a comparison with similar homes in the area
Home Values in the Area
Average Home Value in this Area
Purchase History
| Date | Buyer | Sale Price | Title Company |
|---|---|---|---|
| Whitby Caleb R | $320,000 | None Available | |
| Whitby Caleb R | $320,000 | None Listed On Document | |
| Jeffers David L | $163,500 | -- |
Source: Public Records
Mortgage History
| Date | Status | Borrower | Loan Amount |
|---|---|---|---|
| Open | Whitby Caleb R | $310,400 | |
| Closed | Whitby Caleb R | $310,400 | |
| Previous Owner | Jeffers David L | $147,150 |
Source: Public Records
Tax History Compared to Growth
Tax History
| Year | Tax Paid | Tax Assessment Tax Assessment Total Assessment is a certain percentage of the fair market value that is determined by local assessors to be the total taxable value of land and additions on the property. | Land | Improvement |
|---|---|---|---|---|
| 2025 | $4,429 | $505,594 | $200,000 | $305,594 |
| 2024 | $4,411 | $505,594 | $200,000 | $305,594 |
| 2023 | $3,527 | $321,758 | $115,000 | $206,758 |
| 2022 | $3,278 | $321,758 | $115,000 | $206,758 |
| 2021 | $3,151 | $321,758 | $115,000 | $206,758 |
| 2020 | $3,093 | $321,758 | $115,000 | $206,758 |
| 2019 | $2,731 | $233,936 | $100,000 | $133,936 |
| 2018 | $2,576 | $233,936 | $100,000 | $133,936 |
| 2017 | $2,454 | $233,936 | $100,000 | $133,936 |
| 2016 | $2,365 | $230,206 | $100,000 | $130,206 |
| 2015 | $2,167 | $207,320 | $78,000 | $129,320 |
| 2014 | -- | $207,320 | $78,000 | $129,320 |
Source: Public Records
Map
Nearby Homes
- 2609 Cobworth Ct
- 2610 Sawmill Rd
- 7741 Wilderness Rd
- 2508 Village Grove Rd
- 7401 Ray Rd
- 8913 Taymouth Ct
- 7601 Valview St
- 8920 Taymouth Ct
- 7628 Valview St
- 2428 Havershire Dr
- 2805 Dunkirk Dr
- 6924 Three Bridges Cir
- 8100 Laurel Mountain Rd
- 6502 Brecken Pines Ct
- 7922 Footman Way
- 4104 Betterton Dr
- 7771 Falcon Rest Cir Unit 7771
- 8124 Andrea Ln
- 7704 Falcon Rest Cir
- 2704 Smokey Ridge Rd
- 7424 Old Fox Trail
- 7416 Old Fox Trail
- 7429 Deer Track Dr
- 7437 Deer Track Dr
- 7500 Old Fox Trail
- 7417 Old Fox Trail
- 7412 Old Fox Trail
- 7413 Old Fox Trail
- 7425 Deer Track Dr
- 7441 Deer Track Dr
- 7409 Old Fox Trail
- 7501 Old Fox Trail
- 7421 Deer Track Dr
- 7445 Deer Track Dr
- 7408 Old Fox Trail
- 7405 Peppercorn Ct
- 7504 Old Fox Trail
- 7405 Old Fox Trail
- 7436 Deer Track Dr
- 7440 Deer Track Dr