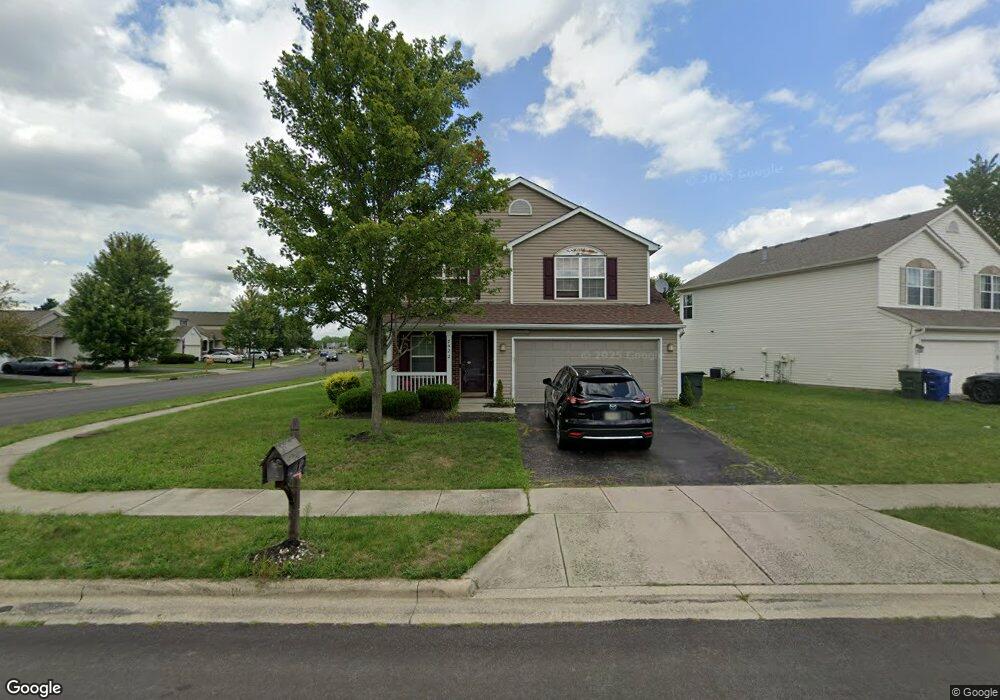
7422 Maple Spice Ave Unit AT60 Canal Winchester, OH 43110
Abbie Trails NeighborhoodEstimated Value: $320,000 - $345,000
4
Beds
3
Baths
2,002
Sq Ft
$166/Sq Ft
Est. Value
About This Home
This home is located at 7422 Maple Spice Ave Unit AT60, Canal Winchester, OH 43110 and is currently estimated at $331,959, approximately $165 per square foot. 7422 Maple Spice Ave Unit AT60 is a home located in Franklin County with nearby schools including Groveport Madison High School and Brice Christian Academy Elementary School.
Ownership History
Date
Name
Owned For
Owner Type
Purchase Details
Closed on
Jan 29, 2020
Sold by
Rutledge Brenda A and Will Of Jimmie L Wells Sr
Bought by
Eghan Eric J
Current Estimated Value
Home Financials for this Owner
Home Financials are based on the most recent Mortgage that was taken out on this home.
Original Mortgage
$199,405
Outstanding Balance
$177,026
Interest Rate
3.74%
Mortgage Type
New Conventional
Estimated Equity
$154,933
Purchase Details
Closed on
Mar 25, 2017
Sold by
Wells Jimmie L and Wells Pcarlic M
Bought by
Wells Jimmie L
Home Financials for this Owner
Home Financials are based on the most recent Mortgage that was taken out on this home.
Original Mortgage
$122,810
Interest Rate
3.97%
Mortgage Type
New Conventional
Purchase Details
Closed on
May 14, 2007
Sold by
Beazer Homes Investments Llc
Bought by
Wells Jimmie L and Wells Pearlie M
Home Financials for this Owner
Home Financials are based on the most recent Mortgage that was taken out on this home.
Original Mortgage
$141,210
Interest Rate
6.2%
Mortgage Type
Purchase Money Mortgage
Create a Home Valuation Report for This Property
The Home Valuation Report is an in-depth analysis detailing your home's value as well as a comparison with similar homes in the area
Home Values in the Area
Average Home Value in this Area
Purchase History
| Date | Buyer | Sale Price | Title Company |
|---|---|---|---|
| Eghan Eric J | $209,900 | None Available | |
| Wells Jimmie L | -- | None Available | |
| Wells Jimmie L | $156,900 | Preferred T |
Source: Public Records
Mortgage History
| Date | Status | Borrower | Loan Amount |
|---|---|---|---|
| Open | Eghan Eric J | $199,405 | |
| Previous Owner | Wells Jimmie L | $122,810 | |
| Previous Owner | Wells Jimmie L | $141,210 |
Source: Public Records
Tax History Compared to Growth
Tax History
| Year | Tax Paid | Tax Assessment Tax Assessment Total Assessment is a certain percentage of the fair market value that is determined by local assessors to be the total taxable value of land and additions on the property. | Land | Improvement |
|---|---|---|---|---|
| 2024 | $4,532 | $104,410 | $27,020 | $77,390 |
| 2023 | $4,489 | $104,405 | $27,020 | $77,385 |
| 2022 | $3,568 | $69,030 | $12,080 | $56,950 |
| 2021 | $3,579 | $69,030 | $12,080 | $56,950 |
| 2020 | $3,585 | $69,030 | $12,080 | $56,950 |
| 2019 | $2,912 | $60,100 | $10,500 | $49,600 |
| 2018 | $2,665 | $60,100 | $10,500 | $49,600 |
| 2017 | $2,656 | $60,100 | $10,500 | $49,600 |
| 2016 | $2,373 | $46,630 | $8,650 | $37,980 |
| 2015 | $2,399 | $46,630 | $8,650 | $37,980 |
| 2014 | $2,426 | $46,630 | $8,650 | $37,980 |
| 2013 | $1,015 | $46,620 | $8,645 | $37,975 |
Source: Public Records
Map
Nearby Homes
- 3972 Bannen Trail Dr
- 6865 Manor Crest Ln
- 7505 Winding Path Ct
- 7449 Sugarbark Ct
- 4028 Boyer Ridge Dr
- 7490 Sugarbark Ct
- 3682 Winding Path Dr
- 3878 Willow Branch Dr
- 3624 Peany Ln
- 6747 Dorothys Crossing Unit 6747
- 6800 Barker Dr
- 6523 Dorothys Creek
- 3535 Wheatfield Dr
- 165 Norland Dr
- 0 Refugee Rd
- 7287 Candlestone Dr
- 3358 Cargin Ct
- 3265 O'Heagra Dr
- 165 Lorrimore Dr
- 165 Balderson Dr
- 7422 Maple Spice Ave
- 7428 Maple Spice Ave
- 3920 Sugarbark Dr
- 3920 Sugarbark Dr Unit 61
- 7434 Maple Spice Ave
- 3925 Sugarbark Dr
- 3925 Sugarbark Dr Unit 4
- 7440 Maple Spice Ave
- 3944 Sugarbark Dr
- 3919 Sugarbark Dr
- 3937 Sugarbark Dr
- 7427 Maple Spice Ave
- 3908 Sugarbark Dr
- 7433 Maple Spice Ave
- 3921 Liriope St
- 7446 Maple Spice Ave
- 7446 Maple Spice Ave Unit AT99
- 7448 Maple Spice Ave Unit AT99
- 3907 Sugarbark Dr
- 3943 Sugarbark Dr