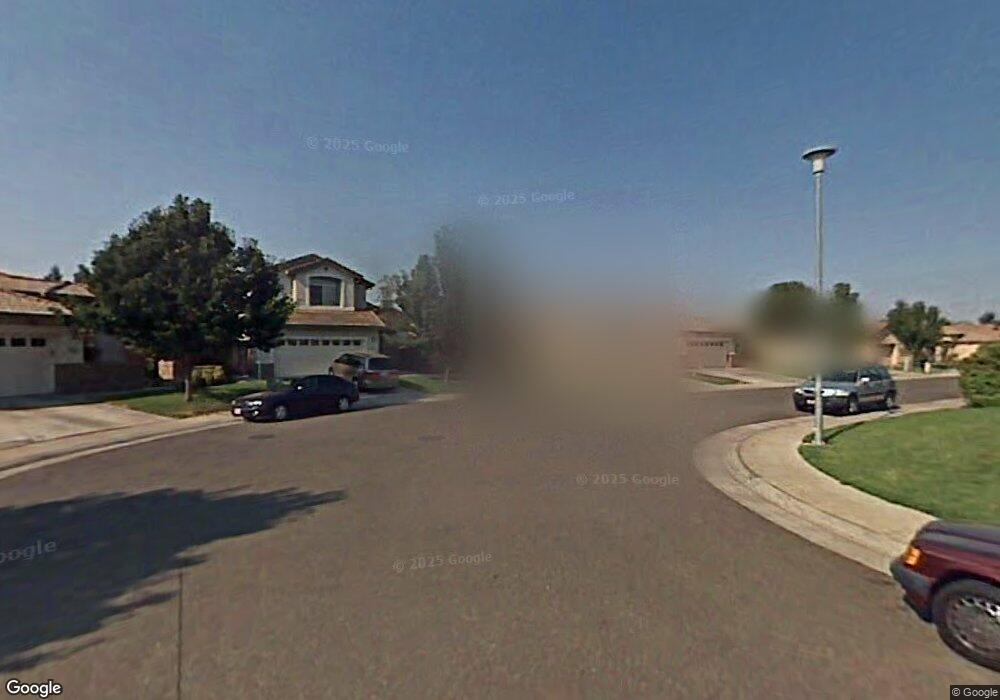
7425 Foyt Ct Elk Grove, CA 95758
North West Elk Grove NeighborhoodEstimated Value: $376,000 - $563,000
3
Beds
2
Baths
1,327
Sq Ft
$373/Sq Ft
Est. Value
About This Home
This home is located at 7425 Foyt Ct, Elk Grove, CA 95758 and is currently estimated at $494,650, approximately $372 per square foot. 7425 Foyt Ct is a home located in Sacramento County with nearby schools including Elitha Donner Elementary School, Harriet G. Eddy Middle School, and Laguna Creek High School.
Ownership History
Date
Name
Owned For
Owner Type
Purchase Details
Closed on
Jan 27, 2003
Sold by
Burvant Lantz S
Bought by
Ozomaro Eddy
Current Estimated Value
Home Financials for this Owner
Home Financials are based on the most recent Mortgage that was taken out on this home.
Original Mortgage
$137,400
Outstanding Balance
$58,330
Interest Rate
5.83%
Estimated Equity
$436,320
Purchase Details
Closed on
Dec 13, 2000
Sold by
Schaffer Kristin G
Bought by
Burvant Lantz S
Home Financials for this Owner
Home Financials are based on the most recent Mortgage that was taken out on this home.
Original Mortgage
$163,400
Interest Rate
7.81%
Purchase Details
Closed on
Feb 3, 2000
Sold by
Elliott Homes Inc
Bought by
Burvant Lantz S and Schaffer Kristin G
Home Financials for this Owner
Home Financials are based on the most recent Mortgage that was taken out on this home.
Original Mortgage
$145,536
Interest Rate
7.96%
Mortgage Type
FHA
Create a Home Valuation Report for This Property
The Home Valuation Report is an in-depth analysis detailing your home's value as well as a comparison with similar homes in the area
Home Values in the Area
Average Home Value in this Area
Purchase History
| Date | Buyer | Sale Price | Title Company |
|---|---|---|---|
| Ozomaro Eddy | $229,000 | Orange Coast Title Company | |
| Burvant Lantz S | -- | Stewart Title | |
| Burvant Lantz S | $147,500 | Stewart Title |
Source: Public Records
Mortgage History
| Date | Status | Borrower | Loan Amount |
|---|---|---|---|
| Open | Ozomaro Eddy | $137,400 | |
| Previous Owner | Burvant Lantz S | $163,400 | |
| Previous Owner | Burvant Lantz S | $145,536 | |
| Closed | Burvant Lantz S | $8,833 |
Source: Public Records
Tax History Compared to Growth
Tax History
| Year | Tax Paid | Tax Assessment Tax Assessment Total Assessment is a certain percentage of the fair market value that is determined by local assessors to be the total taxable value of land and additions on the property. | Land | Improvement |
|---|---|---|---|---|
| 2025 | $3,921 | $331,646 | $86,889 | $244,757 |
| 2024 | $3,921 | $325,144 | $85,186 | $239,958 |
| 2023 | $3,820 | $318,769 | $83,516 | $235,253 |
| 2022 | $3,742 | $312,520 | $81,879 | $230,641 |
| 2021 | $3,680 | $306,393 | $80,274 | $226,119 |
| 2020 | $3,629 | $303,252 | $79,451 | $223,801 |
| 2019 | $3,560 | $297,307 | $77,894 | $219,413 |
| 2018 | $3,465 | $291,478 | $76,367 | $215,111 |
| 2017 | $3,403 | $285,764 | $74,870 | $210,894 |
| 2016 | $3,237 | $280,161 | $73,402 | $206,759 |
| 2015 | $3,076 | $265,782 | $69,636 | $196,146 |
| 2014 | $3,002 | $258,041 | $67,608 | $190,433 |
Source: Public Records
Map
Nearby Homes
- 9508 Delburns Ct
- 9560 Fox Flower Ct
- 9578 Dunkerrin Way
- 7109 Ballygar Way
- 7300 Saltgrass Way
- 7120 Beaver Falls Way
- 7801 Melfort Way
- 9748 Collie Way
- 7905 Baldur Ct
- 9438 Dunkerrin Way
- 9672 Darley Way
- 9510 Village Tree Dr
- 9550 Village Tree Dr
- 9657 Richlyn Way
- 9364 Ivydale Cir
- 6612 Jarrett Ct
- 6421 Noble House Ct
- 7204 Danberg Way
- 9333 Newington Way
- 9357 Hoyleton Way