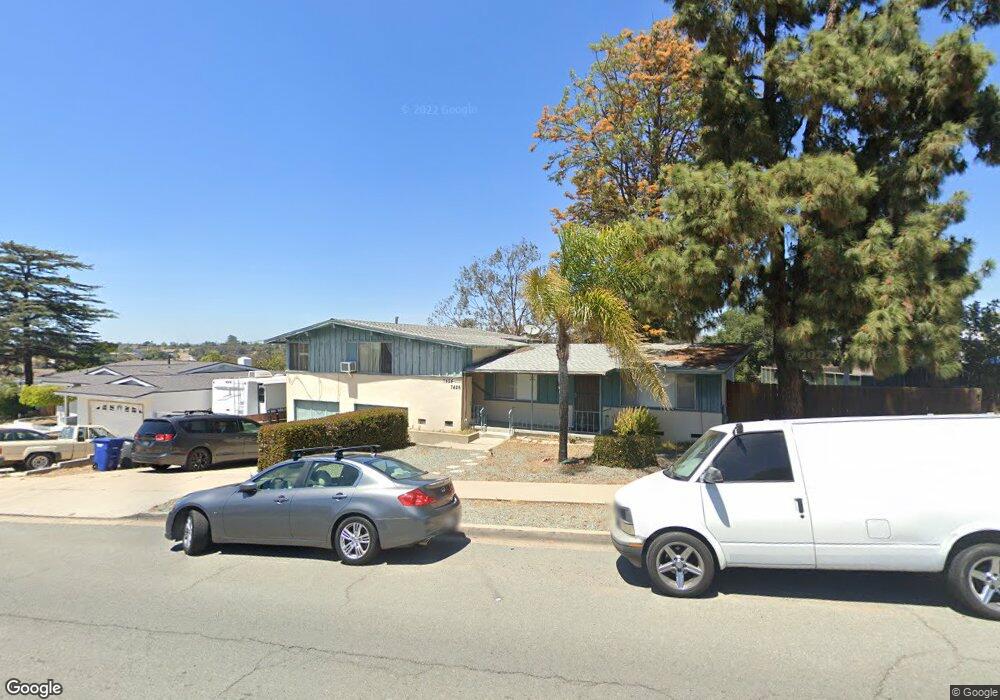
7426 Canton Dr Lemon Grove, CA 91945
Estimated Value: $734,475 - $875,000
4
Beds
2
Baths
1,674
Sq Ft
$488/Sq Ft
Est. Value
About This Home
This home is located at 7426 Canton Dr, Lemon Grove, CA 91945 and is currently estimated at $817,492, approximately $488 per square foot. 7426 Canton Dr is a home located in San Diego County with nearby schools including Monterey Heights Elementary, Mount Miguel High School, and Keiller Leadership Academy.
Ownership History
Date
Name
Owned For
Owner Type
Purchase Details
Closed on
Mar 22, 2022
Sold by
Escrow/Cash Advance Llc
Bought by
Sales Curtis R
Current Estimated Value
Purchase Details
Closed on
Sep 4, 2012
Sold by
Heyenga Dean and Heyenga Judy M
Bought by
Wesley Terry F
Home Financials for this Owner
Home Financials are based on the most recent Mortgage that was taken out on this home.
Original Mortgage
$250,900
Interest Rate
3.62%
Mortgage Type
FHA
Purchase Details
Closed on
Jul 21, 2012
Sold by
Heyenga Harry Dean
Bought by
Heyenga Dean and Heyenga Judy M
Home Financials for this Owner
Home Financials are based on the most recent Mortgage that was taken out on this home.
Original Mortgage
$250,900
Interest Rate
3.62%
Mortgage Type
FHA
Create a Home Valuation Report for This Property
The Home Valuation Report is an in-depth analysis detailing your home's value as well as a comparison with similar homes in the area
Home Values in the Area
Average Home Value in this Area
Purchase History
| Date | Buyer | Sale Price | Title Company |
|---|---|---|---|
| Sales Curtis R | -- | Lawyers Title | |
| Wesley Terry F | $260,000 | Chicago Title Company | |
| Heyenga Dean | -- | None Available |
Source: Public Records
Mortgage History
| Date | Status | Borrower | Loan Amount |
|---|---|---|---|
| Previous Owner | Wesley Terry F | $250,900 |
Source: Public Records
Tax History Compared to Growth
Tax History
| Year | Tax Paid | Tax Assessment Tax Assessment Total Assessment is a certain percentage of the fair market value that is determined by local assessors to be the total taxable value of land and additions on the property. | Land | Improvement |
|---|---|---|---|---|
| 2025 | $5,131 | $320,161 | $78,817 | $241,344 |
| 2024 | $5,131 | $313,884 | $77,272 | $236,612 |
| 2023 | $5,022 | $307,730 | $75,757 | $231,973 |
| 2022 | $5,001 | $301,697 | $74,272 | $227,425 |
| 2021 | $4,946 | $295,782 | $72,816 | $222,966 |
| 2020 | $4,876 | $292,750 | $72,070 | $220,680 |
| 2019 | $4,791 | $287,010 | $70,657 | $216,353 |
| 2018 | $4,681 | $281,383 | $69,272 | $212,111 |
| 2017 | $4,603 | $275,866 | $67,914 | $207,952 |
| 2016 | $4,429 | $270,458 | $66,583 | $203,875 |
| 2015 | $4,407 | $266,396 | $65,583 | $200,813 |
| 2014 | $4,252 | $261,179 | $64,299 | $196,880 |
Source: Public Records
Map
Nearby Homes
- 1277 Glencoe Dr
- 1795 Lemon Grove Ave
- 1928 Noble St
- 1164 Woodrow Ave Unit 2
- 1062 Armacost Rd
- 2256 El Prado Ave
- 7215 San Pasqual St
- 2069 Dayton Dr
- 1817 Ramon St
- 1845 Madera St
- 8046-48 Sarawak Dr
- 7505-7 Mount Vernon St
- 1935 Berry St
- 1862 Washington St
- 7087 Russan Ln
- 1434 San Altos Place
- 8105 Dorchester St
- 2363 Mcknight Dr
- 8118 Brampton St
- 2369 Ravenwood Dr
- 7422 Canton Dr
- 7425 Canton Dr
- 7414 Canton Dr
- 7421 Canton Dr
- 1680 Taft St
- 7408 Canton Dr
- 1643 Woodrow Ave
- 7525 Canton Dr
- 7415 Canton Dr
- 1686 Larwood Rd
- 1685 Watwood Rd
- 1637 Woodrow Ave
- 7402 Canton Dr
- 1660 Taft St
- 1675 Taft St
- 1680 Larwood Rd
- 7555 Canton Dr
- 1679 Watwood Rd
- 1631 Woodrow Ave
- 7360 Canton Dr