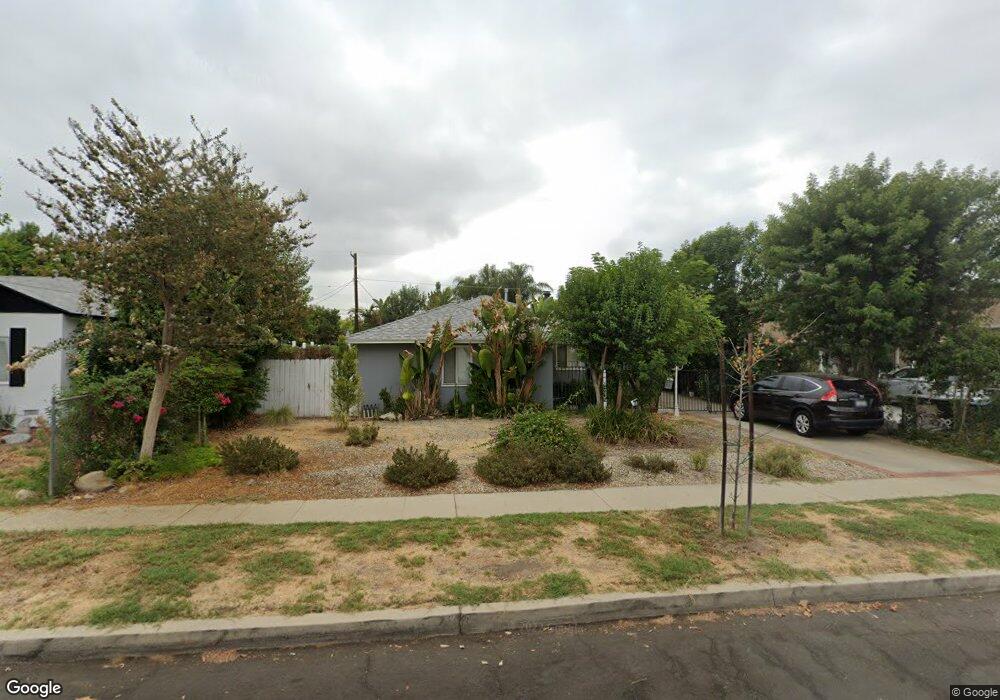
7426 Penfield Ave Winnetka, CA 91306
Estimated Value: $786,000 - $835,000
2
Beds
1
Bath
1,282
Sq Ft
$631/Sq Ft
Est. Value
About This Home
This home is located at 7426 Penfield Ave, Winnetka, CA 91306 and is currently estimated at $808,977, approximately $631 per square foot. 7426 Penfield Ave is a home located in Los Angeles County with nearby schools including Stanley Mosk Elementary School, John A. Sutter Middle School, and Northridge Academy High.
Ownership History
Date
Name
Owned For
Owner Type
Purchase Details
Closed on
Mar 4, 2004
Sold by
Keyvan Bahram
Bought by
Sobhi Mehrnoosh
Current Estimated Value
Home Financials for this Owner
Home Financials are based on the most recent Mortgage that was taken out on this home.
Original Mortgage
$268,000
Interest Rate
6%
Mortgage Type
Purchase Money Mortgage
Purchase Details
Closed on
Jan 26, 2004
Sold by
Ruiz Gustavo
Bought by
Sobhi Mehrnoosh
Home Financials for this Owner
Home Financials are based on the most recent Mortgage that was taken out on this home.
Original Mortgage
$268,000
Interest Rate
6%
Mortgage Type
Purchase Money Mortgage
Purchase Details
Closed on
Apr 16, 1998
Sold by
Federal National Mortgage Association
Bought by
Ruiz Gustavo A
Home Financials for this Owner
Home Financials are based on the most recent Mortgage that was taken out on this home.
Original Mortgage
$111,150
Interest Rate
7.05%
Mortgage Type
Seller Take Back
Purchase Details
Closed on
Oct 10, 1997
Sold by
Denis Joseph A and Federal National Mortgage Asso
Bought by
Federal National Mortgage Association
Create a Home Valuation Report for This Property
The Home Valuation Report is an in-depth analysis detailing your home's value as well as a comparison with similar homes in the area
Home Values in the Area
Average Home Value in this Area
Purchase History
| Date | Buyer | Sale Price | Title Company |
|---|---|---|---|
| Sobhi Mehrnoosh | -- | Southland Title | |
| Sobhi Mehrnoosh | $335,000 | Southland Title | |
| Ruiz Gustavo A | $117,000 | Chicago Title Co | |
| Federal National Mortgage Association | $128,626 | -- |
Source: Public Records
Mortgage History
| Date | Status | Borrower | Loan Amount |
|---|---|---|---|
| Previous Owner | Sobhi Mehrnoosh | $268,000 | |
| Previous Owner | Ruiz Gustavo A | $111,150 | |
| Closed | Sobhi Mehrnoosh | $50,250 |
Source: Public Records
Tax History Compared to Growth
Tax History
| Year | Tax Paid | Tax Assessment Tax Assessment Total Assessment is a certain percentage of the fair market value that is determined by local assessors to be the total taxable value of land and additions on the property. | Land | Improvement |
|---|---|---|---|---|
| 2025 | $5,774 | $476,281 | $381,031 | $95,250 |
| 2024 | $5,774 | $466,943 | $373,560 | $93,383 |
| 2023 | $5,663 | $457,788 | $366,236 | $91,552 |
| 2022 | $5,400 | $448,812 | $359,055 | $89,757 |
| 2021 | $5,329 | $440,013 | $352,015 | $87,998 |
| 2019 | $5,169 | $426,964 | $341,575 | $85,389 |
| 2018 | $5,088 | $418,593 | $334,878 | $83,715 |
| 2017 | $4,974 | $410,386 | $328,312 | $82,074 |
| 2016 | $4,854 | $402,340 | $321,875 | $80,465 |
| 2015 | $4,783 | $396,298 | $317,041 | $79,257 |
| 2014 | $4,804 | $388,536 | $310,831 | $77,705 |
Source: Public Records
Map
Nearby Homes
- 7400 Lubao Ave
- 20110 Cohasset St
- 20122 Cohasset St
- 7539 Hatillo Ave
- 20134 Leadwell St Unit 306
- 20134 Leadwell St Unit 156
- 20134 Leadwell St Unit 217
- 20134 Leadwell St Unit 133
- 20214 Cohasset St
- 20158 Cohasset St Unit 10
- 19803 Covello St
- 20155 Keswick St Unit 209
- 7421 Jumilla Ave
- 20235 Keswick St Unit 102
- 7640 Oso Ave Unit 316
- 7640 Oso Ave Unit 217
- 19714 Lull St
- 19730 Hatton St
- 7800 Winnetka Ave
- 20253 Keswick St Unit 326
- 7432 Penfield Ave
- 7420 Penfield Ave
- 7427 Lubao Ave
- 7438 Penfield Ave
- 7414 Penfield Ave
- 7433 Lubao Ave
- 7421 Lubao Ave
- 7412 Penfield Ave
- 7427 Penfield Ave
- 7439 Lubao Ave
- 7415 Lubao Ave
- 7433 Penfield Ave
- 7421 Penfield Ave
- 7444 Penfield Ave
- 7406 Penfield Ave
- 7439 Penfield Ave
- 7415 Penfield Ave
- 7445 Lubao Ave
- 7407 Lubao Ave
- 7500 Penfield Ave