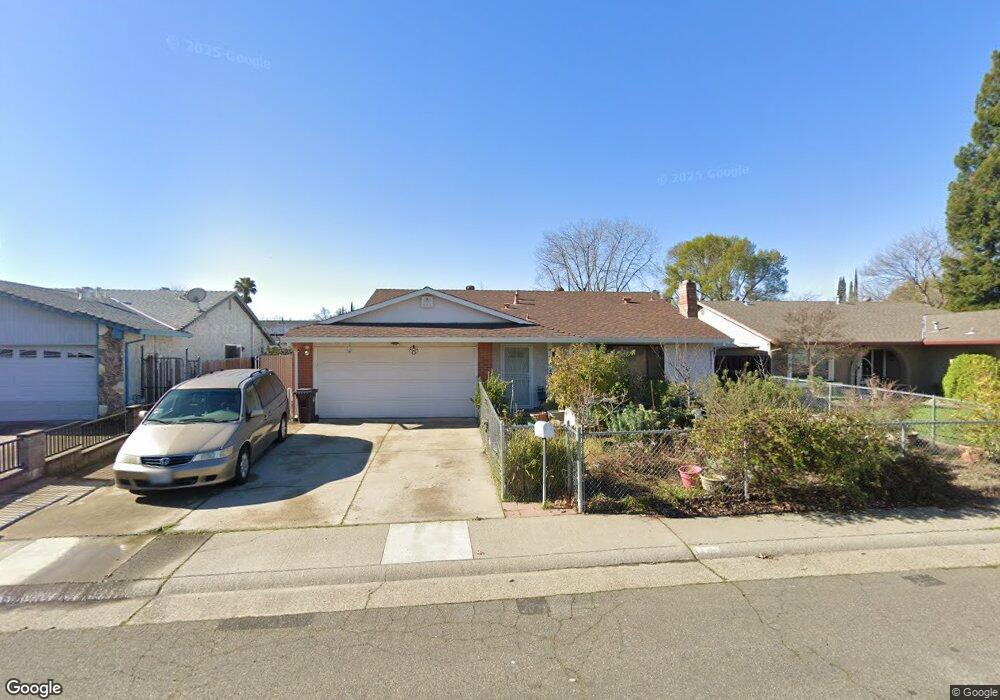
7429 Blackthorne Way Citrus Heights, CA 95621
Estimated Value: $287,000 - $475,750
3
Beds
2
Baths
1,416
Sq Ft
$300/Sq Ft
Est. Value
About This Home
This home is located at 7429 Blackthorne Way, Citrus Heights, CA 95621 and is currently estimated at $425,438, approximately $300 per square foot. 7429 Blackthorne Way is a home located in Sacramento County with nearby schools including Grand Oaks Elementary School, Sylvan Middle School, and Mesa Verde High School.
Ownership History
Date
Name
Owned For
Owner Type
Purchase Details
Closed on
Mar 15, 2023
Sold by
Oback Julie F
Bought by
Julie F Oback Revocable Trust
Current Estimated Value
Purchase Details
Closed on
Aug 23, 2018
Sold by
Oback Julie F and Eleanor Meux 2005 Revocable Tr
Bought by
Oback Julie F
Purchase Details
Closed on
Aug 16, 2005
Sold by
Meux Eleanor Frances
Bought by
Meux Eleanor and Eleanor Meux 2005 Revocable Tr
Purchase Details
Closed on
Jun 4, 2004
Sold by
Clement Barbara J and Hoffman Barbara J
Bought by
Meux Eleanor Frances
Home Financials for this Owner
Home Financials are based on the most recent Mortgage that was taken out on this home.
Original Mortgage
$170,000
Interest Rate
4.87%
Mortgage Type
New Conventional
Create a Home Valuation Report for This Property
The Home Valuation Report is an in-depth analysis detailing your home's value as well as a comparison with similar homes in the area
Home Values in the Area
Average Home Value in this Area
Purchase History
| Date | Buyer | Sale Price | Title Company |
|---|---|---|---|
| Julie F Oback Revocable Trust | -- | -- | |
| Oback Julie F | -- | None Available | |
| Meux Eleanor | -- | -- | |
| Meux Eleanor Frances | $283,000 | First American Title Co | |
| Clement Barbara J | -- | First American Title Co |
Source: Public Records
Mortgage History
| Date | Status | Borrower | Loan Amount |
|---|---|---|---|
| Previous Owner | Clement Barbara J | $170,000 |
Source: Public Records
Tax History Compared to Growth
Tax History
| Year | Tax Paid | Tax Assessment Tax Assessment Total Assessment is a certain percentage of the fair market value that is determined by local assessors to be the total taxable value of land and additions on the property. | Land | Improvement |
|---|---|---|---|---|
| 2025 | $2,464 | $207,141 | $62,134 | $145,007 |
| 2024 | $2,464 | $203,080 | $60,916 | $142,164 |
| 2023 | $2,402 | $199,099 | $59,722 | $139,377 |
| 2022 | $2,390 | $195,196 | $58,551 | $136,645 |
| 2021 | $2,350 | $191,369 | $57,403 | $133,966 |
| 2020 | $2,307 | $189,408 | $56,815 | $132,593 |
| 2019 | $2,261 | $185,695 | $55,701 | $129,994 |
| 2018 | $2,235 | $182,055 | $54,609 | $127,446 |
| 2017 | $2,128 | $178,487 | $53,539 | $124,948 |
| 2016 | $1,987 | $174,989 | $52,490 | $122,499 |
| 2015 | $1,952 | $172,361 | $51,702 | $120,659 |
| 2014 | $1,911 | $168,986 | $50,690 | $118,296 |
Source: Public Records
Map
Nearby Homes
- 7448 Blackthorne Way
- 7439 Saybrook Dr
- 7401 Springvale Way
- 7449 Mar Vista Way
- 5956 Birchglade Way
- 6004 Windlass Ct
- 6133 Glenhurst Way
- 7516 Scaup Ln
- 7533 Pintail Cir
- 7225 Catamaran Dr
- 6501 Navion Dr
- 7600 Golden Eye Ln Unit 43
- 6508 Skylane Dr
- 6020 Cackler Ln
- 7128 Parkvale Way
- 7101 Schooner Way
- 7428 White River Ln Unit 175
- 7032 Sunburst Way
- 6008 Cackler Ln Unit 88
- 5832 Alameda Ln Unit 138
- 7423 Blackthorne Way
- 7435 Blackthorne Way
- 7427 Parkvale Way
- 7431 Parkvale Way
- 7417 Blackthorne Way
- 7423 Parkvale Way
- 7430 Blackthorne Way
- 7446 Springvale Way
- 7435 Parkvale Way
- 7436 Blackthorne Way
- 7442 Springvale Way
- 7424 Blackthorne Way
- 7411 Blackthorne Way
- 7442 Blackthorne Way
- 7438 Springvale Way
- 7439 Parkvale Way
- 7418 Blackthorne Way
- 7419 Parkvale Way
- 7434 Springvale Way
- 7420 Parkvale Way