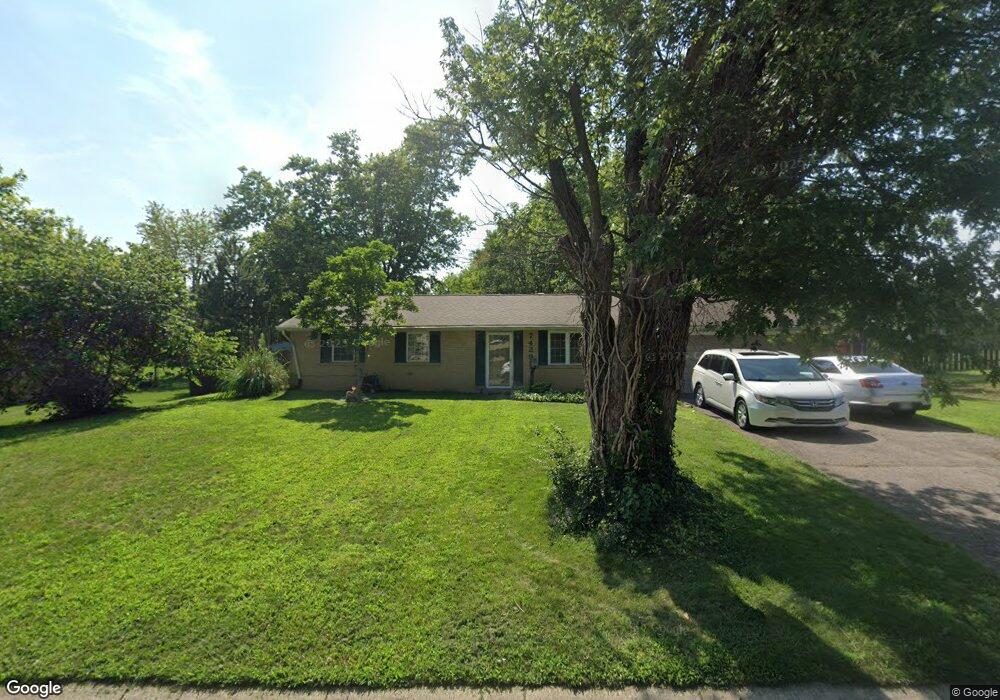
7429 Mohawk Trail Rd Dayton, OH 45459
Woodbourne-Hyde Park NeighborhoodEstimated Value: $214,000 - $243,000
3
Beds
1
Bath
1,050
Sq Ft
$213/Sq Ft
Est. Value
About This Home
This home is located at 7429 Mohawk Trail Rd, Dayton, OH 45459 and is currently estimated at $223,309, approximately $212 per square foot. 7429 Mohawk Trail Rd is a home located in Montgomery County with nearby schools including Miamisburg High School, Miami Valley Academies, and Bishop Leibold School.
Ownership History
Date
Name
Owned For
Owner Type
Purchase Details
Closed on
Feb 11, 2014
Sold by
Hedger Ronald
Bought by
Ali Properties Llc
Current Estimated Value
Purchase Details
Closed on
Feb 7, 2014
Sold by
Weller Mortgages Inc
Bought by
Hedger Ronald and Hedger Ron
Purchase Details
Closed on
May 6, 2013
Sold by
Hedger Ronald and Hedger Ronald L
Bought by
Weller Mortgage Inc
Purchase Details
Closed on
May 6, 2010
Sold by
Us Bank National Association Nd
Bought by
Hedger Ron
Home Financials for this Owner
Home Financials are based on the most recent Mortgage that was taken out on this home.
Original Mortgage
$55,850
Interest Rate
5.16%
Mortgage Type
Purchase Money Mortgage
Purchase Details
Closed on
Mar 10, 2010
Sold by
Saylor Robert H
Bought by
Us Bank National Association Nd
Home Financials for this Owner
Home Financials are based on the most recent Mortgage that was taken out on this home.
Original Mortgage
$55,850
Interest Rate
5.16%
Mortgage Type
Purchase Money Mortgage
Create a Home Valuation Report for This Property
The Home Valuation Report is an in-depth analysis detailing your home's value as well as a comparison with similar homes in the area
Home Values in the Area
Average Home Value in this Area
Purchase History
| Date | Buyer | Sale Price | Title Company |
|---|---|---|---|
| Ali Properties Llc | $66,000 | Sterling Land Title North Ll | |
| Hedger Ronald | -- | None Available | |
| Weller Mortgage Inc | $50,000 | None Available | |
| Hedger Ron | $55,000 | None Available | |
| Us Bank National Association Nd | $95,250 | Attorney |
Source: Public Records
Mortgage History
| Date | Status | Borrower | Loan Amount |
|---|---|---|---|
| Previous Owner | Hedger Ron | $55,850 |
Source: Public Records
Tax History Compared to Growth
Tax History
| Year | Tax Paid | Tax Assessment Tax Assessment Total Assessment is a certain percentage of the fair market value that is determined by local assessors to be the total taxable value of land and additions on the property. | Land | Improvement |
|---|---|---|---|---|
| 2024 | $3,939 | $55,270 | $9,360 | $45,910 |
| 2023 | $3,939 | $55,270 | $9,360 | $45,910 |
| 2022 | $3,432 | $40,820 | $6,930 | $33,890 |
| 2021 | $3,245 | $40,820 | $6,930 | $33,890 |
| 2020 | $3,195 | $40,820 | $6,930 | $33,890 |
| 2019 | $2,144 | $24,730 | $6,930 | $17,800 |
| 2018 | $2,129 | $24,730 | $6,930 | $17,800 |
| 2017 | $2,118 | $24,730 | $6,930 | $17,800 |
| 2016 | $2,209 | $24,730 | $6,930 | $17,800 |
| 2015 | $2,172 | $24,730 | $6,930 | $17,800 |
| 2014 | $2,172 | $24,730 | $6,930 | $17,800 |
| 2012 | -- | $37,760 | $11,170 | $26,590 |
Source: Public Records
Map
Nearby Homes
- 2560 Delavan Dr
- 2334 Mardell Dr
- 488 Crossing Ln
- 550 Crossing Ln
- 2207 Southlea Dr
- 7061 Rivendell Cir
- 3091 Simpson Ct
- 3057 Wellington Ln Unit 8264
- Yeats Plan at Chamberlin Crossing
- Turnbull Plan at Chamberlin Crossing
- 3052 Simpson Ct
- 3052 Simpson Ct Unit 8337
- 3091 Simpson Ct Unit 8355
- 488 Crossing Ln
- Remington Plan at Chamberlin Crossing
- 460 Crossing Ln
- Salinger Plan at Chamberlin Crossing
- Sinclair Plan at Chamberlin Crossing
- 474 Crossing Ln
- 3067 Simpson Ct Unit 8349
- 7419 Mohawk Trail Rd
- 7441 Mohawk Trail Rd
- 7425 Countess Ct
- 7430 Mohawk Trail Rd
- 7416 Countess Ct
- 7409 Mohawk Trail Rd
- 7455 Mohawk Trail Rd
- 7440 Mohawk Trail Rd
- 7410 Mohawk Trail Rd
- 2340 Delavan Dr
- 7450 Mohawk Trail Rd
- 7417 Countess Ct
- 2200 Bellsburg Dr
- 7469 Mohawk Trail Rd
- 2300 Delavan Dr
- 2188 Bellsburg Dr
- 2164 Bellsburg Dr
- 7460 Mohawk Trail Rd
- 2400 Delavan Dr
- 2152 Bellsburg Dr