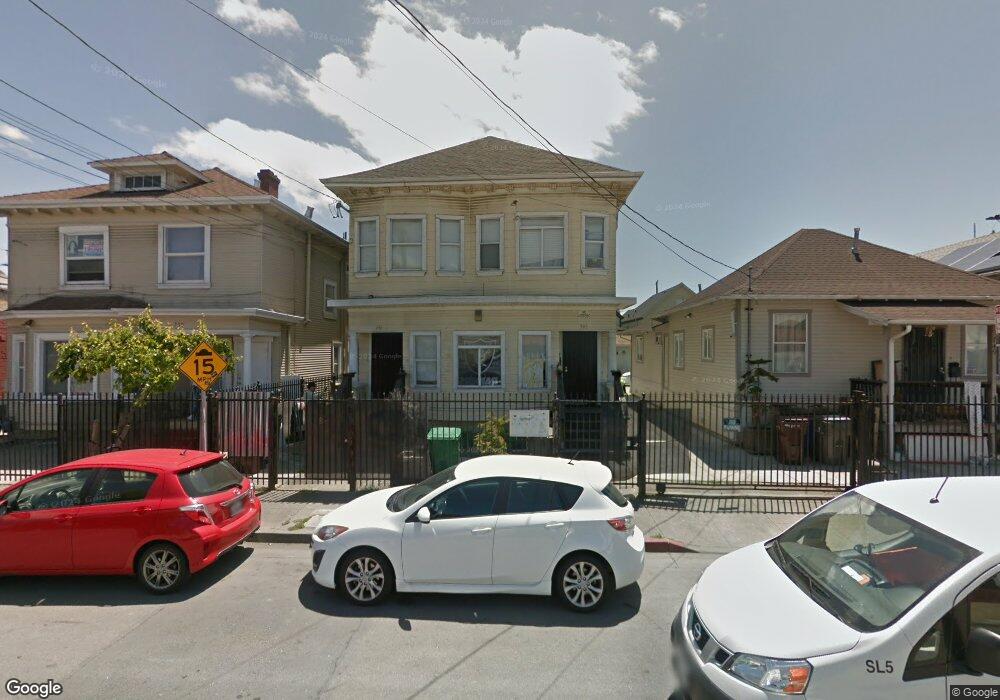
743 26th St Oakland, CA 94612
Hoover-Foster NeighborhoodEstimated Value: $392,000 - $651,972
--
Bed
2
Baths
2,282
Sq Ft
$226/Sq Ft
Est. Value
About This Home
This home is located at 743 26th St, Oakland, CA 94612 and is currently estimated at $514,993, approximately $225 per square foot. 743 26th St is a home located in Alameda County with nearby schools including M. L. King Jr. Elementary School, Westlake Middle School, and McClymonds High School.
Ownership History
Date
Name
Owned For
Owner Type
Purchase Details
Closed on
Dec 17, 2007
Sold by
Yang Alan C and Tsui Kimberly
Bought by
Tsui Kimberly
Current Estimated Value
Purchase Details
Closed on
Jul 25, 2002
Sold by
Yang Cheng Fuat and Tsui Kimberly
Bought by
Yang Alan C and Tsui Kimberly
Home Financials for this Owner
Home Financials are based on the most recent Mortgage that was taken out on this home.
Original Mortgage
$312,500
Outstanding Balance
$132,381
Interest Rate
6.7%
Estimated Equity
$382,612
Purchase Details
Closed on
Dec 3, 1999
Sold by
Nelson Katherine and Nelson Thelma
Bought by
Yang Cheng Fuat and Tsui Kimberly
Home Financials for this Owner
Home Financials are based on the most recent Mortgage that was taken out on this home.
Original Mortgage
$112,500
Interest Rate
9.25%
Create a Home Valuation Report for This Property
The Home Valuation Report is an in-depth analysis detailing your home's value as well as a comparison with similar homes in the area
Home Values in the Area
Average Home Value in this Area
Purchase History
| Date | Buyer | Sale Price | Title Company |
|---|---|---|---|
| Tsui Kimberly | -- | None Available | |
| Yang Alan C | -- | Fidelity National Title Co | |
| Yang Cheng Fuat | $125,000 | New Century Title Co |
Source: Public Records
Mortgage History
| Date | Status | Borrower | Loan Amount |
|---|---|---|---|
| Open | Yang Alan C | $312,500 | |
| Closed | Yang Cheng Fuat | $112,500 |
Source: Public Records
Tax History Compared to Growth
Tax History
| Year | Tax Paid | Tax Assessment Tax Assessment Total Assessment is a certain percentage of the fair market value that is determined by local assessors to be the total taxable value of land and additions on the property. | Land | Improvement |
|---|---|---|---|---|
| 2025 | $4,729 | $192,110 | $57,633 | $134,477 |
| 2024 | $4,729 | $188,344 | $56,503 | $131,841 |
| 2023 | $4,820 | $184,651 | $55,395 | $129,256 |
| 2022 | $4,560 | $181,031 | $54,309 | $126,722 |
| 2021 | $4,163 | $177,483 | $53,245 | $124,238 |
| 2020 | $4,113 | $175,664 | $52,699 | $122,965 |
| 2019 | $3,833 | $172,220 | $51,666 | $120,554 |
| 2018 | $3,756 | $168,844 | $50,653 | $118,191 |
| 2017 | $3,563 | $165,534 | $49,660 | $115,874 |
| 2016 | $3,374 | $162,290 | $48,687 | $113,603 |
| 2015 | $3,352 | $159,851 | $47,955 | $111,896 |
| 2014 | $3,385 | $156,720 | $47,016 | $109,704 |
Source: Public Records
Map
Nearby Homes
- 729 26th St
- 734 25th St
- 2521 San Pablo Ave
- 710 24th St
- 2625 San Pablo Ave
- 863 27th St
- 2327 San Pablo Ave
- 760 29th St
- 2311 San Pablo Ave
- 2530 Market St
- 0 29th St Unit 424026805
- 730 29th St Unit 107
- 878 Athens Ave
- 850 W Grand Ave Unit 6
- 2505 Market St
- 2621 Market St
- 943 26th St
- 861 W Grand Ave
- 2827 Market St
- 2825 Market St