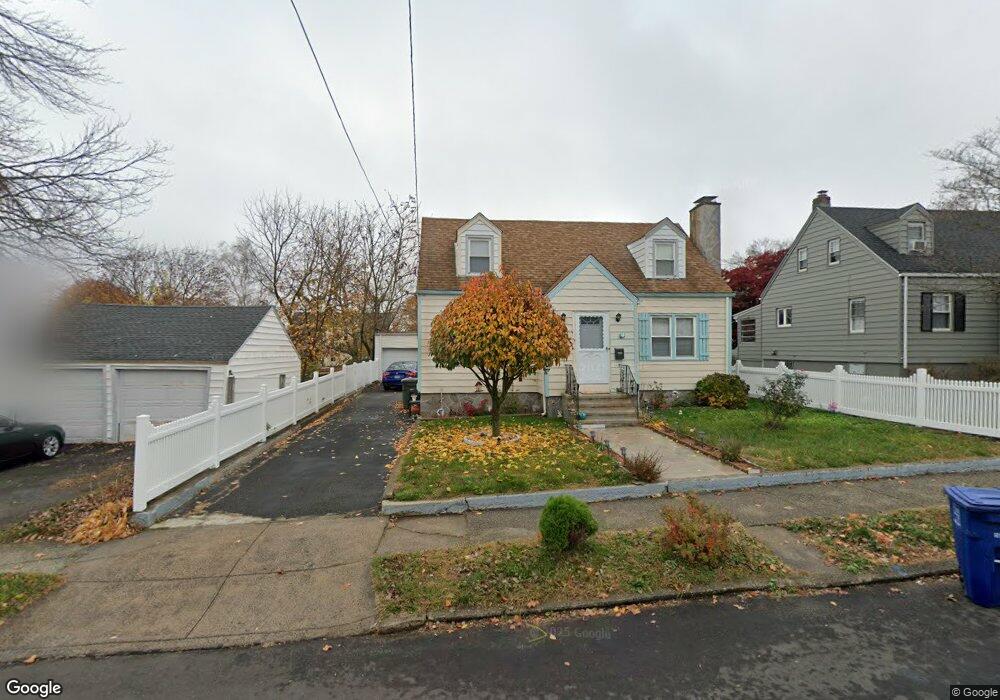
743 Clark St Bridgeport, CT 06606
North End NeighborhoodEstimated Value: $384,000 - $418,000
3
Beds
2
Baths
1,248
Sq Ft
$322/Sq Ft
Est. Value
About This Home
This home is located at 743 Clark St, Bridgeport, CT 06606 and is currently estimated at $401,565, approximately $321 per square foot. 743 Clark St is a home located in Fairfield County with nearby schools including Blackham School, Central High School, and Assumption Catholic School.
Ownership History
Date
Name
Owned For
Owner Type
Purchase Details
Closed on
Apr 12, 2010
Sold by
Bank Of New York
Bought by
Pachero Norma
Current Estimated Value
Home Financials for this Owner
Home Financials are based on the most recent Mortgage that was taken out on this home.
Original Mortgage
$162,187
Outstanding Balance
$108,662
Interest Rate
5.12%
Estimated Equity
$292,903
Purchase Details
Closed on
Jan 19, 2010
Sold by
Rocha-Dacosta Lucineia
Bought by
Bank Of New York
Purchase Details
Closed on
Jun 16, 2006
Sold by
Hough Edythe and Popp Marilyn
Bought by
Dacosta Lucineia
Home Financials for this Owner
Home Financials are based on the most recent Mortgage that was taken out on this home.
Original Mortgage
$259,803
Interest Rate
6.62%
Create a Home Valuation Report for This Property
The Home Valuation Report is an in-depth analysis detailing your home's value as well as a comparison with similar homes in the area
Home Values in the Area
Average Home Value in this Area
Purchase History
| Date | Buyer | Sale Price | Title Company |
|---|---|---|---|
| Pachero Norma | $155,000 | -- | |
| Pachero Norma | $155,000 | -- | |
| Bank Of New York | -- | -- | |
| Bank Of New York | -- | -- | |
| Dacosta Lucineia | $286,500 | -- | |
| Dacosta Lucineia | $286,500 | -- |
Source: Public Records
Mortgage History
| Date | Status | Borrower | Loan Amount |
|---|---|---|---|
| Open | Dacosta Lucineia | $162,187 | |
| Closed | Dacosta Lucineia | $162,187 | |
| Previous Owner | Dacosta Lucineia | $259,803 |
Source: Public Records
Tax History Compared to Growth
Tax History
| Year | Tax Paid | Tax Assessment Tax Assessment Total Assessment is a certain percentage of the fair market value that is determined by local assessors to be the total taxable value of land and additions on the property. | Land | Improvement |
|---|---|---|---|---|
| 2025 | $6,487 | $149,300 | $75,310 | $73,990 |
| 2024 | $6,487 | $149,300 | $75,310 | $73,990 |
| 2023 | $6,487 | $149,300 | $75,310 | $73,990 |
| 2022 | $6,487 | $149,300 | $75,310 | $73,990 |
| 2021 | $6,487 | $149,300 | $75,310 | $73,990 |
| 2020 | $5,569 | $103,140 | $39,340 | $63,800 |
| 2019 | $5,569 | $103,140 | $39,340 | $63,800 |
| 2018 | $5,608 | $103,140 | $39,340 | $63,800 |
| 2017 | $5,608 | $103,140 | $39,340 | $63,800 |
| 2016 | $5,608 | $103,140 | $39,340 | $63,800 |
| 2015 | $5,523 | $130,880 | $47,600 | $83,280 |
| 2014 | $5,523 | $130,880 | $47,600 | $83,280 |
Source: Public Records
Map
Nearby Homes
- 783 Clark St
- 932 Thorme St
- 3430 Park Ave
- 3450 Park Ave
- 605 Merritt St
- 3200 Park Ave Unit 11C2
- 3200 Park Ave Unit 11E2
- 720 Queen St
- 604 Birmingham St
- 681 Westfield Ave
- 520 Savoy St
- 226 Alberta St
- 375 Ruth St
- 129 Ashton St
- 485 Westfield Ave
- 376 Savoy St
- 161 Brion Dr
- 38 Enid St Unit B
- 533 Glendale Ave
- 81 Ameridge Dr