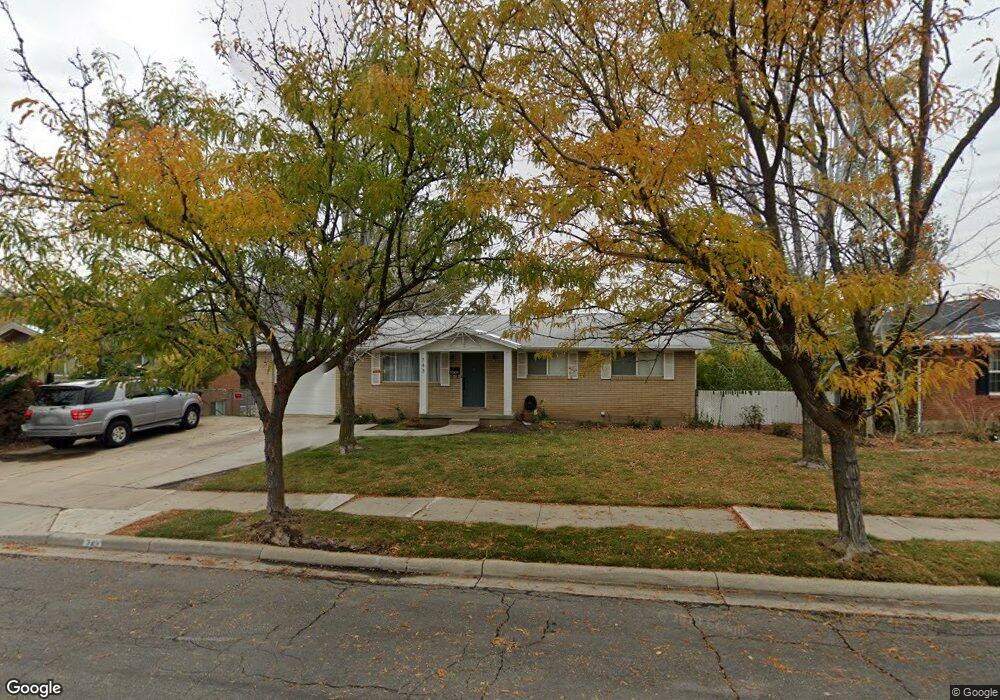
743 N 800 E Bountiful, UT 84010
Estimated Value: $521,000 - $582,000
4
Beds
2
Baths
2,379
Sq Ft
$230/Sq Ft
Est. Value
About This Home
This home is located at 743 N 800 E, Bountiful, UT 84010 and is currently estimated at $547,089, approximately $229 per square foot. 743 N 800 E is a home located in Davis County with nearby schools including Holbrook Elementary School, Bountiful Junior High School, and Bountiful High School.
Ownership History
Date
Name
Owned For
Owner Type
Purchase Details
Closed on
Jul 20, 2020
Sold by
Archletta Brooke J
Bought by
Archletta Brooke Jon and Archletta Lori Kay
Current Estimated Value
Home Financials for this Owner
Home Financials are based on the most recent Mortgage that was taken out on this home.
Original Mortgage
$263,000
Outstanding Balance
$233,644
Interest Rate
3.2%
Mortgage Type
New Conventional
Estimated Equity
$313,445
Purchase Details
Closed on
Mar 26, 2018
Sold by
Archuletta Brooke and Archuletta Lori
Bought by
Archuletta Brooke Jon and Archuletta Living Trust
Purchase Details
Closed on
Jun 23, 2017
Sold by
Brooke Jon Archuletta Trust
Bought by
Archuletta Brook and Archuletta Lori
Home Financials for this Owner
Home Financials are based on the most recent Mortgage that was taken out on this home.
Original Mortgage
$222,000
Interest Rate
4.02%
Mortgage Type
New Conventional
Purchase Details
Closed on
Feb 24, 2015
Sold by
Archuletta Brooke Jon
Bought by
Archuletta Brooke Jon and Archuletta Lori Kay
Purchase Details
Closed on
Sep 6, 2005
Sold by
Tvi Enterprises Llc
Bought by
Archuletta Brooke Jon
Home Financials for this Owner
Home Financials are based on the most recent Mortgage that was taken out on this home.
Original Mortgage
$136,800
Interest Rate
5.87%
Mortgage Type
Fannie Mae Freddie Mac
Purchase Details
Closed on
May 27, 2005
Sold by
Iorg Trent M and Iorg Valerie J
Bought by
Tvi Enterprises Llc
Purchase Details
Closed on
Mar 14, 2005
Sold by
The Secretary Of Housing And Urban Devel
Bought by
Jilorg Trent and Jilorg Valerie
Home Financials for this Owner
Home Financials are based on the most recent Mortgage that was taken out on this home.
Original Mortgage
$20,945
Interest Rate
5.53%
Mortgage Type
Stand Alone Second
Purchase Details
Closed on
Oct 28, 2004
Sold by
Mortgage Electronic Registration System
Bought by
Hud
Purchase Details
Closed on
Aug 24, 2004
Sold by
Bailey Scott
Bought by
Mortgage Electronic Regisration Systems
Purchase Details
Closed on
Apr 15, 2002
Sold by
Frew Leeann M
Bought by
Bailey Scott
Home Financials for this Owner
Home Financials are based on the most recent Mortgage that was taken out on this home.
Original Mortgage
$152,554
Interest Rate
6.78%
Mortgage Type
FHA
Create a Home Valuation Report for This Property
The Home Valuation Report is an in-depth analysis detailing your home's value as well as a comparison with similar homes in the area
Purchase History
| Date | Buyer | Sale Price | Title Company |
|---|---|---|---|
| Archletta Brooke Jon | -- | North American Title | |
| Archuletta Brooke J | -- | North American Title | |
| Archuletta Brooke Jon | -- | -- | |
| Archuletta Brook | -- | North American Title | |
| Archuletta Brooke Jon | -- | Attorney | |
| Archuletta Brooke Jon | -- | Premier Title Ins Agency | |
| Tvi Enterprises Llc | -- | -- | |
| Jilorg Trent | -- | Us Title Company Of Utah | |
| Hud | -- | Backman Stewart Title Svcs | |
| Mortgage Electronic Regisration Systems | $163,135 | Backman Stewart Title Svcs | |
| Bailey Scott | -- | Associated Title Company |
Source: Public Records
Mortgage History
| Date | Status | Borrower | Loan Amount |
|---|---|---|---|
| Open | Archuletta Brooke J | $263,000 | |
| Previous Owner | Archuletta Brook | $222,000 | |
| Previous Owner | Archuletta Brooke Jon | $136,800 | |
| Previous Owner | Jilorg Trent | $20,945 | |
| Previous Owner | Jilorg Trent | $111,708 | |
| Previous Owner | Bailey Scott | $152,554 |
Source: Public Records
Tax History
| Year | Tax Paid | Tax Assessment Tax Assessment Total Assessment is a certain percentage of the fair market value that is determined by local assessors to be the total taxable value of land and additions on the property. | Land | Improvement |
|---|---|---|---|---|
| 2025 | $2,951 | $269,500 | $119,204 | $150,296 |
| 2024 | $2,774 | $262,900 | $110,120 | $152,780 |
| 2023 | $2,659 | $457,000 | $196,885 | $260,115 |
| 2022 | $2,812 | $265,650 | $104,455 | $161,195 |
| 2021 | $2,398 | $345,000 | $155,016 | $189,984 |
| 2020 | $2,114 | $305,000 | $141,212 | $163,788 |
| 2019 | $2,135 | $301,000 | $145,356 | $155,644 |
| 2018 | $1,991 | $276,000 | $134,161 | $141,839 |
| 2016 | $1,587 | $118,360 | $40,815 | $77,545 |
| 2015 | $1,563 | $110,055 | $40,815 | $69,240 |
| 2014 | $1,549 | $112,365 | $40,815 | $71,550 |
| 2013 | -- | $103,166 | $42,890 | $60,276 |
Source: Public Records
Map
Nearby Homes
- 749 E 400 N
- 129 N 800 E
- 908 Northern Hills Dr Unit 3
- 683 E 100 N
- 513 N 400 E Unit 14B
- 933 Northern Hills Cir
- 6 N 800 E
- 282 E 650 N
- 978 N 170 E
- 698 E 200 S
- 214 E 1250 N
- 17 E 400 N Unit 19B
- 1342 E Skyline Dr N Unit 30
- 49 E 200 N Unit 4
- 41 E 200 N Unit 6
- 55 E 200 N Unit 2
- 51 E 200 N Unit 3
- 256 N Main St
- 254 N Main St
- 252 N Main St
Your Personal Tour Guide
Ask me questions while you tour the home.