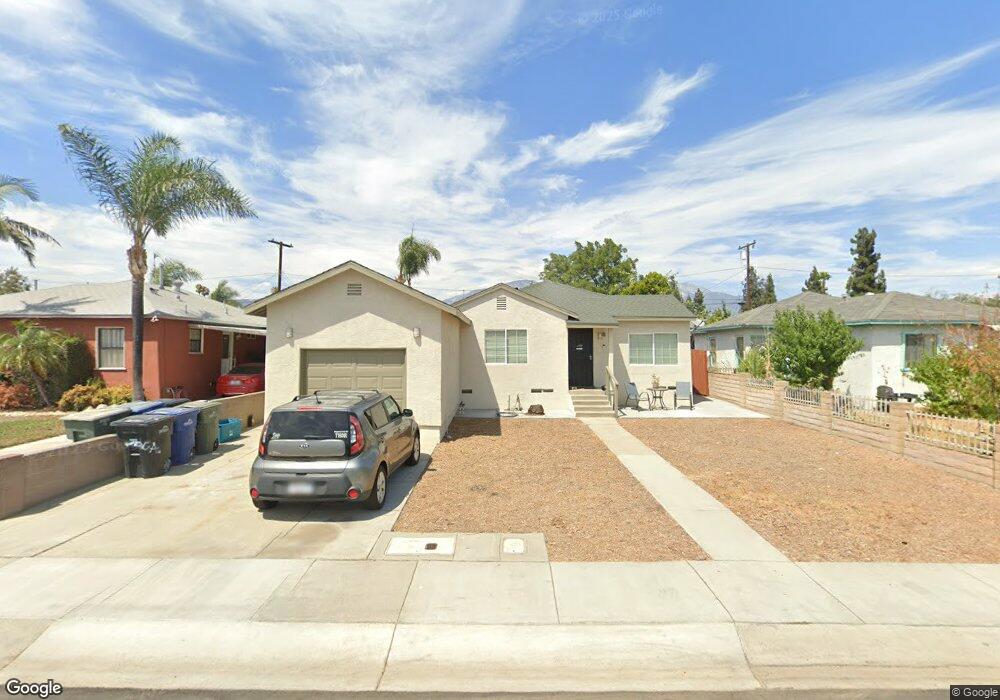
743 Plaza Serena Ontario, CA 91764
Downtown Ontario NeighborhoodEstimated Value: $610,000 - $701,000
3
Beds
4
Baths
1,558
Sq Ft
$418/Sq Ft
Est. Value
About This Home
This home is located at 743 Plaza Serena, Ontario, CA 91764 and is currently estimated at $650,947, approximately $417 per square foot. 743 Plaza Serena is a home located in San Bernardino County with nearby schools including Berlyn Elementary, Vina Danks Middle, and Chaffey High School.
Ownership History
Date
Name
Owned For
Owner Type
Purchase Details
Closed on
Jan 17, 2020
Sold by
Valadezi Lorenzo
Bought by
Valadezi Lorenzo and The Valadez Revocable Living T
Current Estimated Value
Purchase Details
Closed on
Apr 15, 2019
Sold by
Serrato Vanessa Valadez and Valadez Diana
Bought by
Valadez Lorenzo
Purchase Details
Closed on
May 8, 2014
Sold by
Valadez Lorenzo and Valadez Yolanda Nelly
Bought by
Serrato Vanessa Valadez and Valadez Diana
Create a Home Valuation Report for This Property
The Home Valuation Report is an in-depth analysis detailing your home's value as well as a comparison with similar homes in the area
Home Values in the Area
Average Home Value in this Area
Purchase History
| Date | Buyer | Sale Price | Title Company |
|---|---|---|---|
| Valadezi Lorenzo | -- | None Available | |
| Valadez Lorenzo | -- | None Available | |
| Serrato Vanessa Valadez | -- | None Available |
Source: Public Records
Tax History Compared to Growth
Tax History
| Year | Tax Paid | Tax Assessment Tax Assessment Total Assessment is a certain percentage of the fair market value that is determined by local assessors to be the total taxable value of land and additions on the property. | Land | Improvement |
|---|---|---|---|---|
| 2025 | $2,370 | $219,325 | $57,614 | $161,711 |
| 2024 | $2,370 | $215,024 | $56,484 | $158,540 |
| 2023 | $2,303 | $210,807 | $55,376 | $155,431 |
| 2022 | $2,273 | $206,673 | $54,290 | $152,383 |
| 2021 | $2,258 | $202,620 | $53,225 | $149,395 |
| 2020 | $2,219 | $200,542 | $52,679 | $147,863 |
| 2019 | $2,200 | $196,610 | $51,646 | $144,964 |
| 2018 | $2,170 | $192,755 | $50,633 | $142,122 |
| 2017 | $2,092 | $188,975 | $49,640 | $139,335 |
| 2016 | $2,010 | $185,270 | $48,667 | $136,603 |
| 2015 | $1,996 | $182,487 | $47,936 | $134,551 |
| 2014 | $1,967 | $178,912 | $46,997 | $131,915 |
Source: Public Records
Map
Nearby Homes