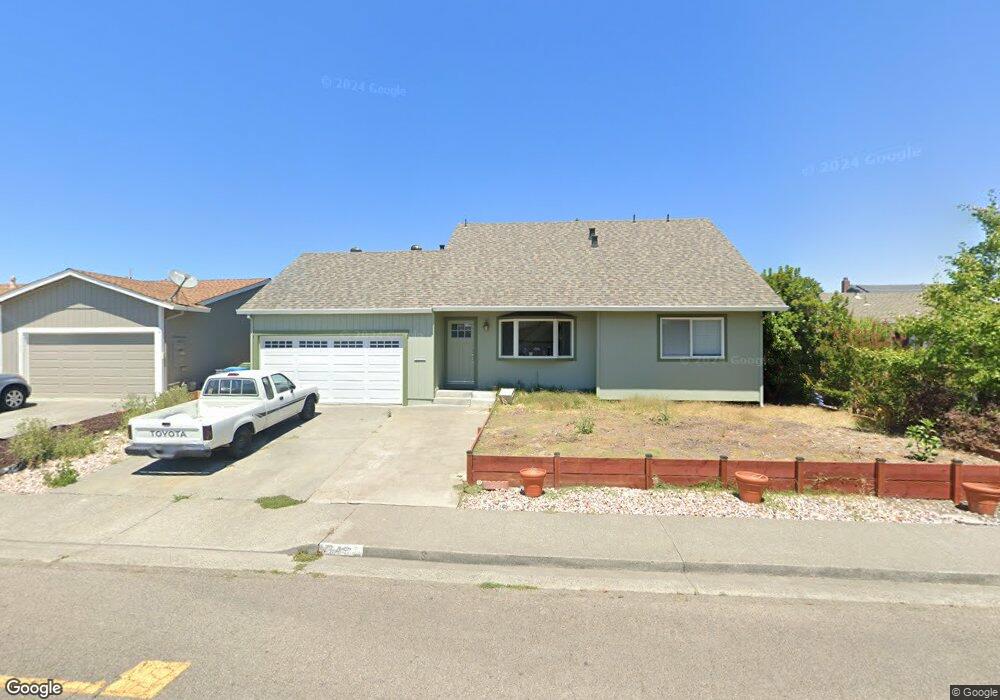
743 Rancho Way Petaluma, CA 94954
Adobe NeighborhoodEstimated Value: $817,196 - $859,000
4
Beds
2
Baths
1,633
Sq Ft
$514/Sq Ft
Est. Value
About This Home
This home is located at 743 Rancho Way, Petaluma, CA 94954 and is currently estimated at $839,049, approximately $513 per square foot. 743 Rancho Way is a home located in Sonoma County with nearby schools including La Tercera Elementary School, Kenilworth Junior High School, and Casa Grande High School.
Ownership History
Date
Name
Owned For
Owner Type
Purchase Details
Closed on
Nov 11, 2021
Sold by
Lafleur Martin and Lafleur Ruth
Bought by
Lafleur Ruth
Current Estimated Value
Purchase Details
Closed on
Jun 10, 2002
Sold by
Melara Carlos A and Melara Ana L
Bought by
Lafleur Martin and Lafleur Ruth
Home Financials for this Owner
Home Financials are based on the most recent Mortgage that was taken out on this home.
Original Mortgage
$324,000
Interest Rate
6.74%
Create a Home Valuation Report for This Property
The Home Valuation Report is an in-depth analysis detailing your home's value as well as a comparison with similar homes in the area
Home Values in the Area
Average Home Value in this Area
Purchase History
| Date | Buyer | Sale Price | Title Company |
|---|---|---|---|
| Lafleur Ruth | -- | Lafleur Ruth | |
| Lafleur Martin | $405,000 | Fidelity National Title Co |
Source: Public Records
Mortgage History
| Date | Status | Borrower | Loan Amount |
|---|---|---|---|
| Previous Owner | Lafleur Martin | $324,000 | |
| Closed | Lafleur Martin | $81,000 |
Source: Public Records
Tax History Compared to Growth
Tax History
| Year | Tax Paid | Tax Assessment Tax Assessment Total Assessment is a certain percentage of the fair market value that is determined by local assessors to be the total taxable value of land and additions on the property. | Land | Improvement |
|---|---|---|---|---|
| 2025 | $6,478 | $598,301 | $280,683 | $317,618 |
| 2024 | $6,478 | $586,571 | $275,180 | $311,391 |
| 2023 | $6,478 | $575,071 | $269,785 | $305,286 |
| 2022 | $6,327 | $563,796 | $264,496 | $299,300 |
| 2021 | $6,252 | $552,742 | $259,310 | $293,432 |
| 2020 | $6,296 | $547,076 | $256,652 | $290,424 |
| 2019 | $6,230 | $536,350 | $251,620 | $284,730 |
| 2018 | $6,047 | $525,835 | $246,687 | $279,148 |
| 2017 | $5,958 | $515,525 | $241,850 | $273,675 |
| 2016 | $5,774 | $505,417 | $237,108 | $268,309 |
| 2015 | $5,444 | $482,000 | $226,000 | $256,000 |
| 2014 | $5,004 | $439,000 | $206,000 | $233,000 |
Source: Public Records
Map
Nearby Homes
- 1711 Capistrano Dr
- 642 Albert Way
- 827 Grouse Ln
- 601 Marylyn Cir Unit 21
- 602 Marylyn Cir
- 1302 Marylyn Cir
- 1103 Marylyn Cir
- 1627 Juliet Dr
- 1513 Elizabeth Dr
- 724 Garfield Dr
- 859 S Mcdowell Blvd
- 1052 Helen Ct
- 73 Alta Dr
- 2189 Saint Augustine Cir
- 1312 Glenwood Dr
- 29 Palomino Ct
- 1303 Ponderosa Dr
- 29 Alta Dr
- 4 Starling Dr
- 2014 Crinella Dr