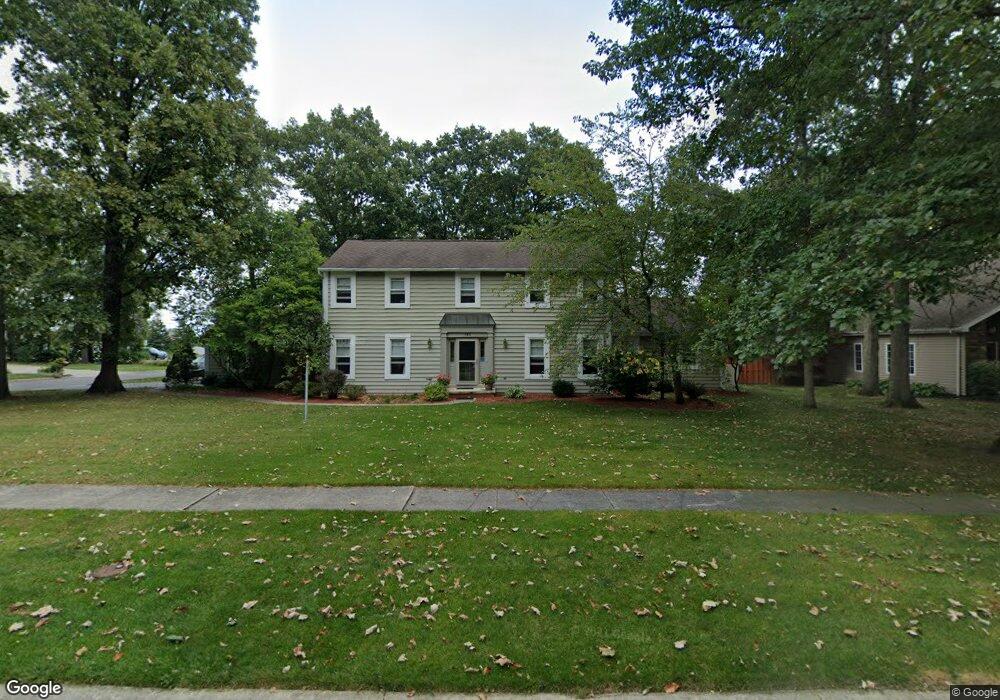
743 Red Fox Rd Findlay, OH 45840
Estimated Value: $383,000 - $439,000
5
Beds
4
Baths
2,813
Sq Ft
$142/Sq Ft
Est. Value
About This Home
This home is located at 743 Red Fox Rd, Findlay, OH 45840 and is currently estimated at $399,643, approximately $142 per square foot. 743 Red Fox Rd is a home located in Hancock County with nearby schools including Wilson Vance Elementary School, Whittier Elementary School, and Glenwood Middle School.
Ownership History
Date
Name
Owned For
Owner Type
Purchase Details
Closed on
Feb 12, 2002
Sold by
Hartman Joy L
Bought by
Davis Judy K
Current Estimated Value
Home Financials for this Owner
Home Financials are based on the most recent Mortgage that was taken out on this home.
Original Mortgage
$127,500
Interest Rate
7.24%
Mortgage Type
New Conventional
Purchase Details
Closed on
Jun 14, 1996
Sold by
Anderson Barry
Bought by
Hartman Joy and Davis Judy
Home Financials for this Owner
Home Financials are based on the most recent Mortgage that was taken out on this home.
Original Mortgage
$94,000
Interest Rate
8.05%
Mortgage Type
New Conventional
Purchase Details
Closed on
Sep 6, 1988
Bought by
Anderson Barry J and Anderson Barbara
Purchase Details
Closed on
Sep 15, 1983
Bought by
Sofyanos Mark A and Sofyanos Wendy G
Create a Home Valuation Report for This Property
The Home Valuation Report is an in-depth analysis detailing your home's value as well as a comparison with similar homes in the area
Home Values in the Area
Average Home Value in this Area
Purchase History
| Date | Buyer | Sale Price | Title Company |
|---|---|---|---|
| Davis Judy K | $90,000 | -- | |
| Hartman Joy | $189,000 | -- | |
| Anderson Barry J | $132,000 | -- | |
| Sofyanos Mark A | $13,700 | -- |
Source: Public Records
Mortgage History
| Date | Status | Borrower | Loan Amount |
|---|---|---|---|
| Previous Owner | Davis Judy K | $127,500 | |
| Previous Owner | Hartman Joy | $94,000 |
Source: Public Records
Tax History Compared to Growth
Tax History
| Year | Tax Paid | Tax Assessment Tax Assessment Total Assessment is a certain percentage of the fair market value that is determined by local assessors to be the total taxable value of land and additions on the property. | Land | Improvement |
|---|---|---|---|---|
| 2024 | $3,193 | $99,680 | $17,110 | $82,570 |
| 2023 | $3,221 | $99,680 | $17,110 | $82,570 |
| 2022 | $3,224 | $99,680 | $17,110 | $82,570 |
| 2021 | $3,082 | $84,450 | $17,110 | $67,340 |
| 2020 | $3,081 | $84,450 | $17,110 | $67,340 |
| 2019 | $3,021 | $84,450 | $17,110 | $67,340 |
| 2018 | $2,560 | $67,650 | $13,690 | $53,960 |
| 2017 | $1,281 | $67,650 | $13,690 | $53,960 |
| 2016 | $2,522 | $67,650 | $13,690 | $53,960 |
| 2015 | $2,268 | $60,600 | $13,690 | $46,910 |
| 2014 | $2,268 | $60,600 | $13,690 | $46,910 |
| 2012 | $2,867 | $73,820 | $13,690 | $60,130 |
Source: Public Records
Map
Nearby Homes
- 0 Meadowview Dr
- 665 Meadowview Dr
- 2231 Bonnie Ln
- 2245 Fox Run Cir Unit 1037
- 801 Fox Run Rd
- 8419 E Woodland Trail
- 7752 E Point Dr
- 15329 E Us Route 224
- 15561 Brookview Trail
- 0 E Us Route 224
- 0 Lakeside Dr
- 7633 Brookstone Dr
- 822 Bright Rd
- 505 Bright Rd
- 267 Sierra Ct
- 2000 Rush Creek Ct
- 207 Wellington Place
- 7507 Township Road 212
- 1932 Queenswood Dr
- 1926 Queenswood Dr
- 743 Redfox Rd
- 737 Redfox Rd
- 744 Redfox Rd
- 2530 Foxwood Dr
- 2530 Foxwood Dr
- 731 Red Fox Rd
- 731 Redfox Rd
- 2520 Foxwood Dr
- 738 Redfox Rd
- 2510 Foxwood Dr
- 734 Red Fox Rd
- 732 Redfox Rd
- 770 Meadowview Dr
- 732 Red Fox Rd
- 760 Meadowview Dr
- 725 Redfox Rd
- 2515 Foxwood Dr
- 725 Red Fox Rd
- 780 Meadowview Dr
- 2500 Foxwood Dr