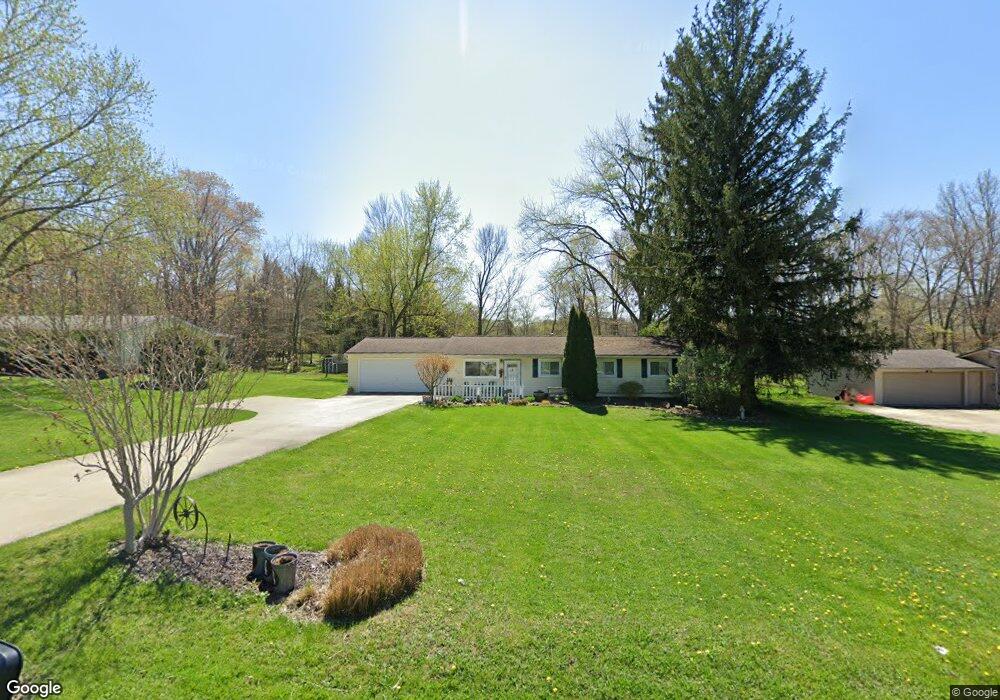
743 Robinhood Dr Aurora, OH 44202
Estimated Value: $240,577 - $279,000
4
Beds
2
Baths
1,170
Sq Ft
$219/Sq Ft
Est. Value
About This Home
This home is located at 743 Robinhood Dr, Aurora, OH 44202 and is currently estimated at $255,894, approximately $218 per square foot. 743 Robinhood Dr is a home located in Portage County with nearby schools including Miller Elementary School, Craddock/Miller Elementary School, and Leighton Elementary School.
Ownership History
Date
Name
Owned For
Owner Type
Purchase Details
Closed on
Feb 1, 2006
Sold by
Metzger Kathleen J and Budnick Kathleen J
Bought by
Metzger Kathleen J and Metzger Revocable L Kathleen J
Current Estimated Value
Purchase Details
Closed on
May 12, 2002
Sold by
Metzger William
Bought by
Metzger Kathleen J
Purchase Details
Closed on
Aug 3, 1999
Sold by
Hassan Kimberly A and Hassan Smeltz
Bought by
Metzger William and Metzger Kathleen J
Home Financials for this Owner
Home Financials are based on the most recent Mortgage that was taken out on this home.
Original Mortgage
$95,200
Outstanding Balance
$27,421
Interest Rate
7.68%
Estimated Equity
$228,473
Purchase Details
Closed on
Sep 26, 1995
Sold by
Moore John B
Bought by
Kimberly A Hassan
Home Financials for this Owner
Home Financials are based on the most recent Mortgage that was taken out on this home.
Original Mortgage
$79,448
Interest Rate
7.78%
Mortgage Type
FHA
Create a Home Valuation Report for This Property
The Home Valuation Report is an in-depth analysis detailing your home's value as well as a comparison with similar homes in the area
Home Values in the Area
Average Home Value in this Area
Purchase History
| Date | Buyer | Sale Price | Title Company |
|---|---|---|---|
| Metzger Kathleen J | -- | Accommodation | |
| Metzger Kathleen J | -- | Cleveland Title | |
| Metzger William | $115,666 | Midland Title Security Inc | |
| Kimberly A Hassan | $92,100 | -- |
Source: Public Records
Mortgage History
| Date | Status | Borrower | Loan Amount |
|---|---|---|---|
| Open | Metzger William | $95,200 | |
| Closed | Kimberly A Hassan | $79,448 |
Source: Public Records
Tax History Compared to Growth
Tax History
| Year | Tax Paid | Tax Assessment Tax Assessment Total Assessment is a certain percentage of the fair market value that is determined by local assessors to be the total taxable value of land and additions on the property. | Land | Improvement |
|---|---|---|---|---|
| 2024 | $2,717 | $60,770 | $15,300 | $45,470 |
| 2023 | $2,962 | $53,940 | $15,300 | $38,640 |
| 2022 | $2,682 | $53,940 | $15,300 | $38,640 |
| 2021 | $2,697 | $53,940 | $15,300 | $38,640 |
| 2020 | $2,357 | $43,720 | $15,300 | $28,420 |
| 2019 | $2,376 | $43,720 | $15,300 | $28,420 |
| 2018 | $2,347 | $39,520 | $15,300 | $24,220 |
| 2017 | $2,347 | $39,520 | $15,300 | $24,220 |
| 2016 | $2,115 | $39,520 | $15,300 | $24,220 |
| 2015 | $2,175 | $39,520 | $15,300 | $24,220 |
| 2014 | $2,219 | $39,520 | $15,300 | $24,220 |
| 2013 | $2,205 | $39,520 | $15,300 | $24,220 |
Source: Public Records
Map
Nearby Homes
- 794 Robinhood Dr
- 777 Nancy Dr
- 436 Cochran Rd
- 676 Nancy Dr
- 915 Cimarron Oval
- 316 High Bluff
- 185 N Bissell Rd
- 225 Linwood Ln
- 405 Club Dr W
- S/L 4 Trentstone Cir
- 180 Beaumont Trail
- 622 Club Dr W
- S/L 8 Trentstone Cir
- S/L 15 Trentstone Cir
- S/L 1 Trentstone Cir
- 640 Club Dr W
- S/L 3 Iris Place
- 752 Club Dr W
- 805 Club Dr W
- 762 Club Dr W
- 735 Robinhood Dr
- 753 Robinhood Dr
- 725 Robinhood Dr
- 744 Sherwood Dr
- 769 Robinhood Dr
- 736 Sherwood Dr
- 754 Sherwood Dr
- 744 Robinhood Dr
- 736 Robinhood Dr
- 754 Robinhood Dr
- 726 Sherwood Dr
- 770 Sherwood Dr
- 713 Robinhood Dr
- 783 Robinhood Dr
- 726 Robinhood Dr
- 770 Robinhood Dr
- 714 Sherwood Dr
- 784 Sherwood Dr
- 714 Robinhood Dr
- 793 Robinhood Dr