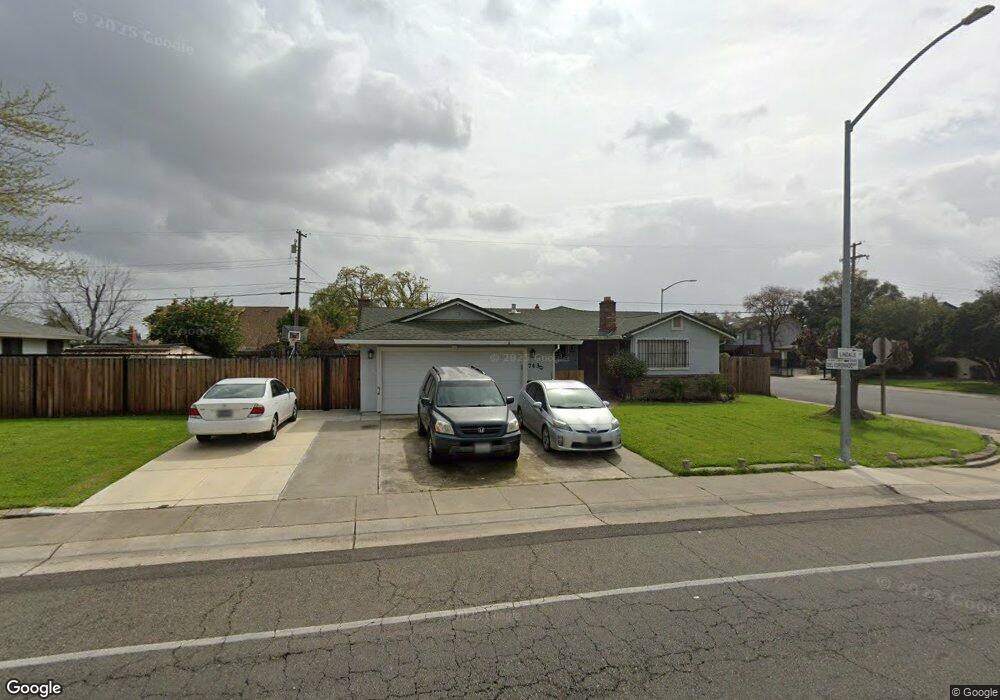
7430 Lindale Dr Unit 3 Sacramento, CA 95828
Estimated Value: $429,000 - $460,482
4
Beds
2
Baths
1,692
Sq Ft
$260/Sq Ft
Est. Value
About This Home
This home is located at 7430 Lindale Dr Unit 3, Sacramento, CA 95828 and is currently estimated at $440,161, approximately $260 per square foot. 7430 Lindale Dr Unit 3 is a home located in Sacramento County with nearby schools including David Reese Elementary School, James Rutter Middle School, and Florin High School.
Ownership History
Date
Name
Owned For
Owner Type
Purchase Details
Closed on
Jan 19, 2011
Sold by
Vang Xia Seu and Vang Chue V
Bought by
Vang Nixon
Current Estimated Value
Home Financials for this Owner
Home Financials are based on the most recent Mortgage that was taken out on this home.
Original Mortgage
$107,211
Outstanding Balance
$71,215
Interest Rate
4.25%
Mortgage Type
FHA
Estimated Equity
$368,946
Purchase Details
Closed on
Dec 17, 2003
Sold by
Vang Cheu V and Vue Chue
Bought by
Vang Xia Seu and Vang Chue V
Home Financials for this Owner
Home Financials are based on the most recent Mortgage that was taken out on this home.
Original Mortgage
$76,500
Interest Rate
6.03%
Mortgage Type
Purchase Money Mortgage
Purchase Details
Closed on
Feb 19, 1999
Sold by
Cochran Family Living Trust and Robert D
Bought by
Vang Xia Seu and Vue Chue
Home Financials for this Owner
Home Financials are based on the most recent Mortgage that was taken out on this home.
Original Mortgage
$78,000
Interest Rate
6.78%
Create a Home Valuation Report for This Property
The Home Valuation Report is an in-depth analysis detailing your home's value as well as a comparison with similar homes in the area
Home Values in the Area
Average Home Value in this Area
Purchase History
| Date | Buyer | Sale Price | Title Company |
|---|---|---|---|
| Vang Nixon | $110,000 | Placer Title Company | |
| Vang Xia Seu | -- | First American Title Co | |
| Vang Xia Seu | $108,000 | First American Title Ins Co |
Source: Public Records
Mortgage History
| Date | Status | Borrower | Loan Amount |
|---|---|---|---|
| Open | Vang Nixon | $107,211 | |
| Previous Owner | Vang Xia Seu | $76,500 | |
| Previous Owner | Vang Xia Seu | $78,000 |
Source: Public Records
Tax History Compared to Growth
Tax History
| Year | Tax Paid | Tax Assessment Tax Assessment Total Assessment is a certain percentage of the fair market value that is determined by local assessors to be the total taxable value of land and additions on the property. | Land | Improvement |
|---|---|---|---|---|
| 2025 | $1,563 | $140,915 | $29,204 | $111,711 |
| 2024 | $1,563 | $138,153 | $28,632 | $109,521 |
| 2023 | $1,524 | $135,445 | $28,071 | $107,374 |
| 2022 | $1,498 | $132,790 | $27,521 | $105,269 |
| 2021 | $1,480 | $130,187 | $26,982 | $103,205 |
| 2020 | $1,445 | $128,853 | $26,706 | $102,147 |
| 2019 | $1,418 | $126,328 | $26,183 | $100,145 |
| 2018 | $1,380 | $123,852 | $25,670 | $98,182 |
| 2017 | $1,357 | $121,424 | $25,167 | $96,257 |
| 2016 | $1,278 | $119,044 | $24,674 | $94,370 |
| 2015 | $1,254 | $117,257 | $24,304 | $92,953 |
| 2014 | $1,234 | $114,961 | $23,828 | $91,133 |
Source: Public Records
Map
Nearby Homes
- 7312 Del Prado Way
- 6944 Mirador Way
- 7548 Lindale Dr
- 7413 Skander Way
- 6400 66th Ave Unit 21
- 7020 Sunnyslope Dr
- 6837 Southwood Way
- 7548 Huckleberry Ln
- 7551 Red Bud Ln
- 7451 Albezzia Ln
- 7825 Rockhurst Way
- 7442 Della Cir
- 7206 Willowwest Ct
- 6124 Pomegranate Ave
- 7633 Clement Cir
- 7928 Rockhurst Way
- 7605 Mctavish Cir
- 6104 Center Mall Way
- 7631 Verna Mae Ave
- 6990 Chris Ave
- 7434 Lindale Dr
- 6801 Ewing Way
- 6805 Ewing Way
- 7420 Lindale Dr
- 7427 Lindale Dr
- 7438 Lindale Dr
- 6809 Ewing Way
- 7304 Del Coronado Way
- 7425 Lindale Dr
- 6828 Fort Pitt Way
- 6813 Ewing Way
- 7308 Del Coronado Way
- 7421 Lindale Dr
- 7416 Lindale Dr
- 7442 Lindale Dr
- 7313 Del Coronado Way
- 6824 Fort Pitt Way
- 6817 Ewing Way
- 7417 Lindale Dr
- 7312 Del Coronado Way