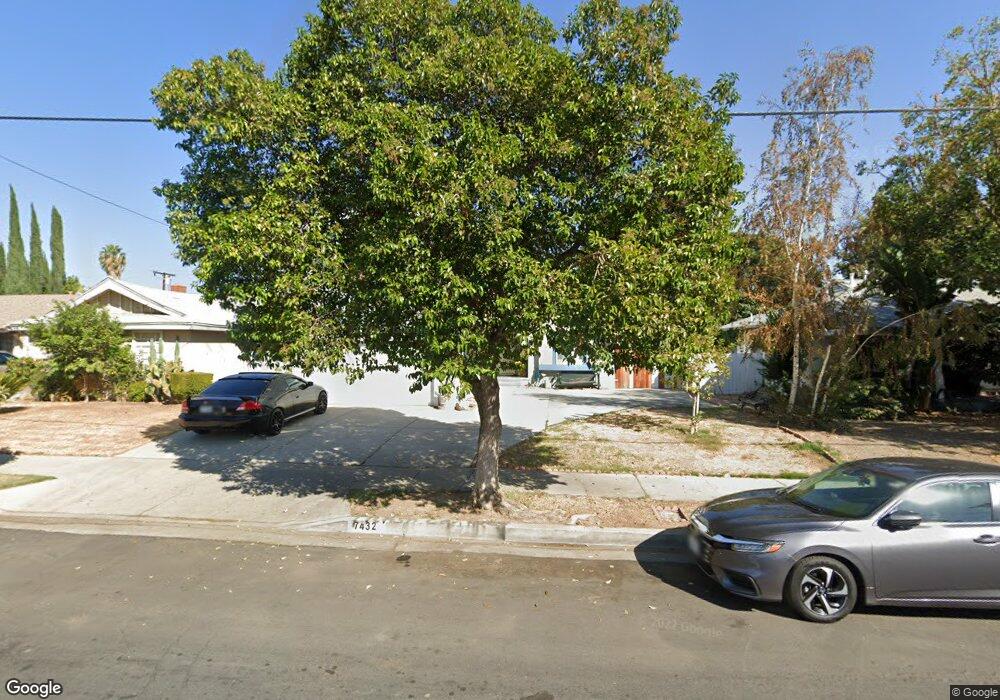
7432 Vanalden Ave Reseda, CA 91335
Estimated Value: $853,689 - $1,030,000
6
Beds
3
Baths
2,444
Sq Ft
$377/Sq Ft
Est. Value
About This Home
This home is located at 7432 Vanalden Ave, Reseda, CA 91335 and is currently estimated at $921,922, approximately $377 per square foot. 7432 Vanalden Ave is a home located in Los Angeles County with nearby schools including Reseda Elementary School, John A. Sutter Middle School, and Northridge Middle School.
Ownership History
Date
Name
Owned For
Owner Type
Purchase Details
Closed on
Jan 6, 2022
Sold by
Sagastume Cesar E and Sagastume Gloria E
Bought by
Sagastume Revocable Living Trust
Current Estimated Value
Purchase Details
Closed on
Feb 2, 1996
Sold by
Stock Hendel Thomas
Bought by
Sagastume Cesar and Sagastume Gloria E
Home Financials for this Owner
Home Financials are based on the most recent Mortgage that was taken out on this home.
Original Mortgage
$134,300
Interest Rate
7%
Purchase Details
Closed on
Apr 14, 1994
Sold by
Stock Hendel Thomas and Stock Hendel Vivian
Bought by
Stock Hendel Thomas
Home Financials for this Owner
Home Financials are based on the most recent Mortgage that was taken out on this home.
Original Mortgage
$116,800
Interest Rate
7.12%
Create a Home Valuation Report for This Property
The Home Valuation Report is an in-depth analysis detailing your home's value as well as a comparison with similar homes in the area
Home Values in the Area
Average Home Value in this Area
Purchase History
| Date | Buyer | Sale Price | Title Company |
|---|---|---|---|
| Sagastume Revocable Living Trust | -- | None Listed On Document | |
| Sagastume Cesar | $158,000 | Chicago Title | |
| Stock Hendel Thomas | -- | World Title Company |
Source: Public Records
Mortgage History
| Date | Status | Borrower | Loan Amount |
|---|---|---|---|
| Previous Owner | Sagastume Cesar | $134,300 | |
| Previous Owner | Stock Hendel Thomas | $116,800 |
Source: Public Records
Tax History
| Year | Tax Paid | Tax Assessment Tax Assessment Total Assessment is a certain percentage of the fair market value that is determined by local assessors to be the total taxable value of land and additions on the property. | Land | Improvement |
|---|---|---|---|---|
| 2025 | $4,514 | $353,803 | $109,793 | $244,010 |
| 2024 | $4,514 | $346,867 | $107,641 | $239,226 |
| 2023 | $4,431 | $340,067 | $105,531 | $234,536 |
| 2022 | $4,234 | $333,400 | $103,462 | $229,938 |
| 2021 | $4,170 | $326,864 | $101,434 | $225,430 |
| 2019 | $4,049 | $317,171 | $98,426 | $218,745 |
| 2018 | $3,915 | $310,953 | $96,497 | $214,456 |
| 2016 | $3,718 | $298,879 | $92,750 | $206,129 |
| 2015 | $3,665 | $294,390 | $91,357 | $203,033 |
| 2014 | $3,682 | $288,624 | $89,568 | $199,056 |
Source: Public Records
Map
Nearby Homes
- 7459 Vanalden Ave
- 7508 Claire Ave
- 7431 Vanalden Ave
- 7535 Vanalden Ave
- 7514 Beckford Ave
- 7551 Donna Ave
- 19016 Runnymede St
- 7326 Vanalden Ave
- 19034 Wyandotte St
- 19230 Wyandotte St Unit 14
- 7645 Wilbur Ave
- 19009 Sherman Way Unit 2
- 19009 Sherman Way Unit 16
- 19160 Ingomar St
- 7650 Wilbur Ave
- 18800 Cohasset St
- 19018 Sherman Way Unit 106
- 18958 Sherman Way Unit 19
- 18954 Sherman Way Unit 3
- 19355 Sherman Way Unit 42
- 7436 Vanalden Ave
- 7428 Vanalden Ave
- 7442 Vanalden Ave
- 7431 Donna Ave
- 7420 Vanalden Ave
- 7425 Donna Ave
- 7435 Donna Ave
- 7418 Vanalden Ave
- 7446 Vanalden Ave
- 7419 Donna Ave
- 7441 Donna Ave
- 7412 Vanalden Ave
- 7445 Donna Ave
- 7413 Donna Ave
- 7441 Vanalden Ave
- 7445 Vanalden Ave
- 7425 Vanalden Ave
- 7406 Vanalden Ave
- 7451 Donna Ave
- 7456 Vanalden Ave
Your Personal Tour Guide
Ask me questions while you tour the home.