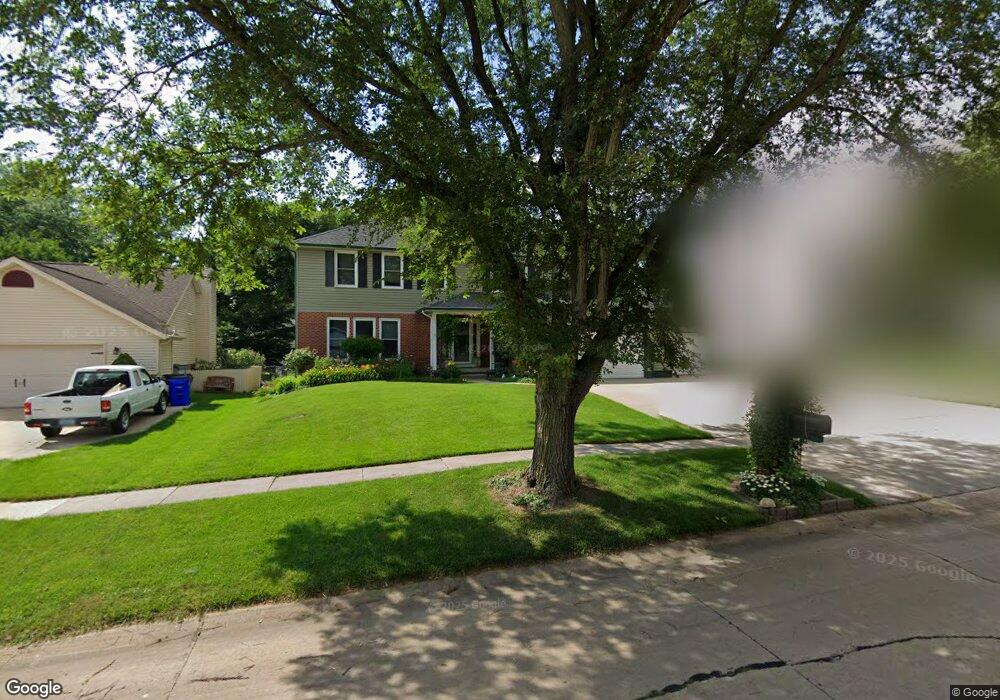
7433 Normandy Dr NE Cedar Rapids, IA 52402
Estimated Value: $335,000 - $392,000
4
Beds
4
Baths
2,348
Sq Ft
$157/Sq Ft
Est. Value
About This Home
This home is located at 7433 Normandy Dr NE, Cedar Rapids, IA 52402 and is currently estimated at $369,698, approximately $157 per square foot. 7433 Normandy Dr NE is a home located in Linn County with nearby schools including Bowman Woods Elementary School, Oak Ridge School, and Linn-Mar High School.
Ownership History
Date
Name
Owned For
Owner Type
Purchase Details
Closed on
Jul 21, 2007
Sold by
Blaauw Frazer Clarence E and Blaauw Frazer Maryann
Bought by
Pople Michael S and Pople Chong Sun
Current Estimated Value
Home Financials for this Owner
Home Financials are based on the most recent Mortgage that was taken out on this home.
Original Mortgage
$197,200
Outstanding Balance
$123,514
Interest Rate
6.54%
Mortgage Type
Purchase Money Mortgage
Estimated Equity
$246,184
Purchase Details
Closed on
Jan 20, 2006
Sold by
Blaauw Jack Carel
Bought by
Frazer Maryann Blaauw and Filosa Maryann Blaauw
Purchase Details
Closed on
Mar 19, 1998
Sold by
Tellin Larry D and Tellin Carol
Bought by
Filosa Maryann Blaauw and Blaauw Jack Carel
Home Financials for this Owner
Home Financials are based on the most recent Mortgage that was taken out on this home.
Original Mortgage
$152,000
Interest Rate
7.14%
Create a Home Valuation Report for This Property
The Home Valuation Report is an in-depth analysis detailing your home's value as well as a comparison with similar homes in the area
Home Values in the Area
Average Home Value in this Area
Purchase History
| Date | Buyer | Sale Price | Title Company |
|---|---|---|---|
| Pople Michael S | $246,000 | None Available | |
| Frazer Maryann Blaauw | -- | None Available | |
| Filosa Maryann Blaauw | $189,500 | -- |
Source: Public Records
Mortgage History
| Date | Status | Borrower | Loan Amount |
|---|---|---|---|
| Open | Pople Michael S | $197,200 | |
| Previous Owner | Filosa Maryann Blaauw | $152,000 |
Source: Public Records
Tax History Compared to Growth
Tax History
| Year | Tax Paid | Tax Assessment Tax Assessment Total Assessment is a certain percentage of the fair market value that is determined by local assessors to be the total taxable value of land and additions on the property. | Land | Improvement |
|---|---|---|---|---|
| 2025 | $6,394 | $352,900 | $65,300 | $287,600 |
| 2024 | $6,286 | $345,400 | $65,300 | $280,100 |
| 2023 | $6,286 | $345,400 | $65,300 | $280,100 |
| 2022 | $5,766 | $287,300 | $59,400 | $227,900 |
| 2021 | $5,744 | $272,800 | $55,400 | $217,400 |
| 2020 | $5,744 | $256,500 | $45,500 | $211,000 |
| 2019 | $5,398 | $244,100 | $45,500 | $198,600 |
| 2018 | $5,160 | $244,100 | $45,500 | $198,600 |
| 2017 | $5,224 | $239,700 | $45,500 | $194,200 |
| 2016 | $4,879 | $221,400 | $45,500 | $175,900 |
| 2015 | $4,925 | $223,277 | $27,720 | $195,557 |
| 2014 | $4,730 | $223,277 | $27,720 | $195,557 |
| 2013 | $4,568 | $223,277 | $27,720 | $195,557 |
Source: Public Records
Map
Nearby Homes
- 7320 Hampshire Dr NE
- 3310 Timber Ridge Ct
- 342 Cambridge Dr NE
- 1000 Hampshire Cir
- 980 Hampshire Cir
- 7415 Pin Tail Dr NE
- 316 Sussex Dr NE
- 960 Hampshire Cir
- 1150 Bedford Ct
- 948 Hampshire Cir
- 6726 Bowman Ln NE
- 916 Hampshire Cir
- 884 Hampshire Cir
- 932 Prescott Ln
- 862 Hampshire Cir
- 820 Hampshire Cir
- 1151 Plumwood Ct NE
- 819 Hampshire Cir
- 7502 Summerset Ave NE
- 786 Hampshire Cir
- 7443 Normandy Dr NE
- 7425 Normandy Dr NE
- 7506 Westbury Dr NE
- 7500 Westbury Dr NE
- 7505 Normandy Dr NE
- 7512 Westbury Dr NE
- 7419 Normandy Dr NE
- 7428 Normandy Dr NE
- 7412 Westbury Dr NE
- 7418 Normandy Dr NE
- 7435 Beckett Dr NE
- 7515 Normandy Dr NE
- 7518 Westbury Dr NE
- 7410 Normandy Dr NE
- 7408 Westbury Dr NE
- 7411 Normandy Dr NE
- 7425 Beckett Dr NE
- 7404 Westbury Dr NE
- 7525 Normandy Dr NE
- 7415 Beckett Dr NE