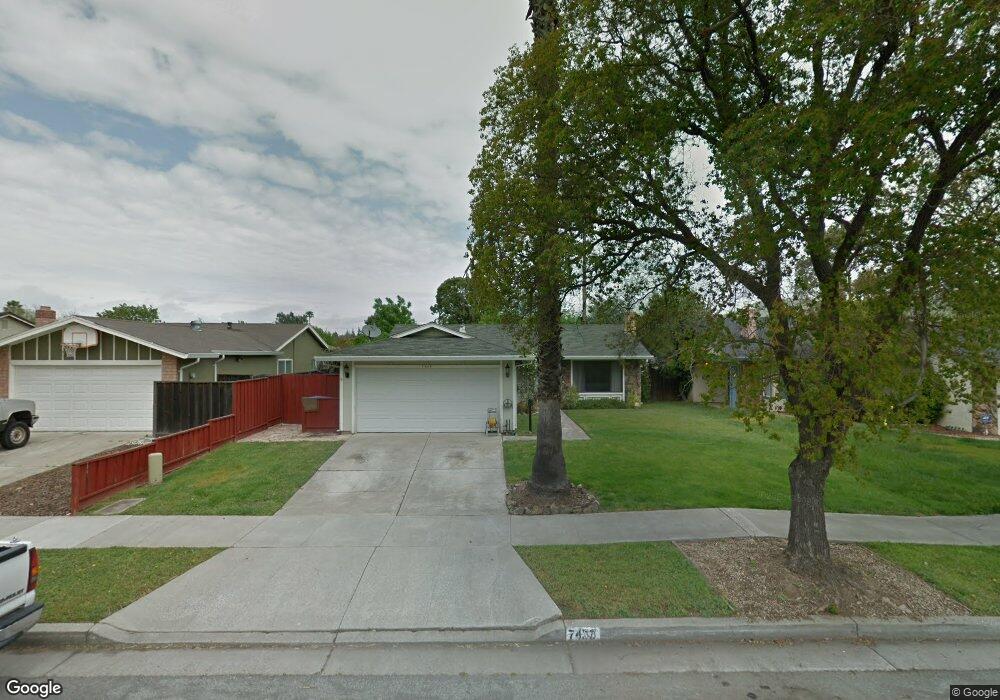
7438 Pegasus Way San Jose, CA 95139
Los Paseos NeighborhoodEstimated Value: $1,218,310 - $1,352,000
3
Beds
2
Baths
1,120
Sq Ft
$1,130/Sq Ft
Est. Value
About This Home
This home is located at 7438 Pegasus Way, San Jose, CA 95139 and is currently estimated at $1,265,828, approximately $1,130 per square foot. 7438 Pegasus Way is a home located in Santa Clara County with nearby schools including Los Paseos Elementary School, Martin Murphy Middle School, and Ann Sobrato High School.
Ownership History
Date
Name
Owned For
Owner Type
Purchase Details
Closed on
Jan 13, 2021
Sold by
Gallaty Gina N and Gallaty Aaron J
Bought by
Gallaty Aaron James and Gatlaty Gina Nicole
Current Estimated Value
Home Financials for this Owner
Home Financials are based on the most recent Mortgage that was taken out on this home.
Original Mortgage
$368,000
Outstanding Balance
$328,441
Interest Rate
2.71%
Mortgage Type
New Conventional
Estimated Equity
$937,387
Purchase Details
Closed on
Sep 26, 2017
Sold by
Gallaty Gina N
Bought by
Gallaty Aaron James and Gallaty Gina Nicole
Purchase Details
Closed on
May 21, 2013
Sold by
Gallaty Aaron
Bought by
Gallaty Gina N
Home Financials for this Owner
Home Financials are based on the most recent Mortgage that was taken out on this home.
Original Mortgage
$436,015
Interest Rate
3.38%
Mortgage Type
New Conventional
Create a Home Valuation Report for This Property
The Home Valuation Report is an in-depth analysis detailing your home's value as well as a comparison with similar homes in the area
Home Values in the Area
Average Home Value in this Area
Purchase History
| Date | Buyer | Sale Price | Title Company |
|---|---|---|---|
| Gallaty Aaron James | -- | Cornerstone Title Company | |
| Gallaty Gina N | -- | Cornerstone Title | |
| Gallaty Aaron James | -- | None Available | |
| Gallaty Gina N | -- | North American Title Company | |
| Gallaty Gina N | $485,000 | North American Title Company |
Source: Public Records
Mortgage History
| Date | Status | Borrower | Loan Amount |
|---|---|---|---|
| Open | Gallaty Gina N | $368,000 | |
| Previous Owner | Gallaty Gina N | $436,015 |
Source: Public Records
Tax History Compared to Growth
Tax History
| Year | Tax Paid | Tax Assessment Tax Assessment Total Assessment is a certain percentage of the fair market value that is determined by local assessors to be the total taxable value of land and additions on the property. | Land | Improvement |
|---|---|---|---|---|
| 2025 | $9,310 | $644,781 | $358,092 | $286,689 |
| 2024 | $9,310 | $632,139 | $351,071 | $281,068 |
| 2023 | $9,121 | $619,745 | $344,188 | $275,557 |
| 2022 | $8,538 | $562,496 | $337,440 | $225,056 |
| 2021 | $8,165 | $551,468 | $330,824 | $220,644 |
| 2020 | $7,831 | $545,814 | $327,432 | $218,382 |
| 2019 | $7,934 | $535,112 | $321,012 | $214,100 |
| 2018 | $7,864 | $524,620 | $314,718 | $209,902 |
| 2017 | $7,374 | $514,335 | $308,548 | $205,787 |
| 2016 | $6,938 | $504,251 | $302,499 | $201,752 |
| 2015 | $6,856 | $496,678 | $297,956 | $198,722 |
| 2014 | $6,562 | $486,950 | $292,120 | $194,830 |
Source: Public Records
Map
Nearby Homes
- 45 Cheltenham Way
- 7392 Tulare Hill Dr
- 133 Cheltenham Way
- 82 Essendon Way
- 7237 Longhill Way
- 7102 Avenida Rotella
- 202 French Ct
- 243 French Ct
- 6986 Gregorich Dr Unit C
- 6978 Gregorich Dr Unit F
- 7270 Alder Spring Way
- 6958 Gregorich Dr Unit G
- 6130 Monterey Rd Unit 201
- 6130 Monterey Rd Unit 289
- 6130 Monterey Rd Unit 9
- 6130 Monterey Rd Unit 159
- 6130 Monterey Rd Unit 260
- 6130 Monterey Rd Unit 316
- 1083 Esparanza Way
- 1075 Esparanza Way
- 7434 Pegasus Way
- 7442 Pegasus Way
- 7430 Pegasus Way
- 14 Cheltenham Way
- 7446 Pegasus Way
- 12 Cheltenham Way
- 16 Cheltenham Way
- 10 Cheltenham Way
- 7426 Pegasus Way
- 18 Cheltenham Way
- 0 Pegasus Ct Unit ML80781305
- 0 Pegasus Ct Unit ML80907835
- 0 Pegasus Ct Unit ML81020278
- 0 Pegasus Ct Unit ML81048586
- 0 Pegasus Ct Unit ML81108868
- 0 Pegasus Ct Unit ML81214279
- 0 Pegasus Ct Unit ML81408465
- 0 Pegasus Ct Unit ML81778460
- 0 Pegasus Ct Unit ML81761677
- 0 Pegasus Ct Unit ML81735133