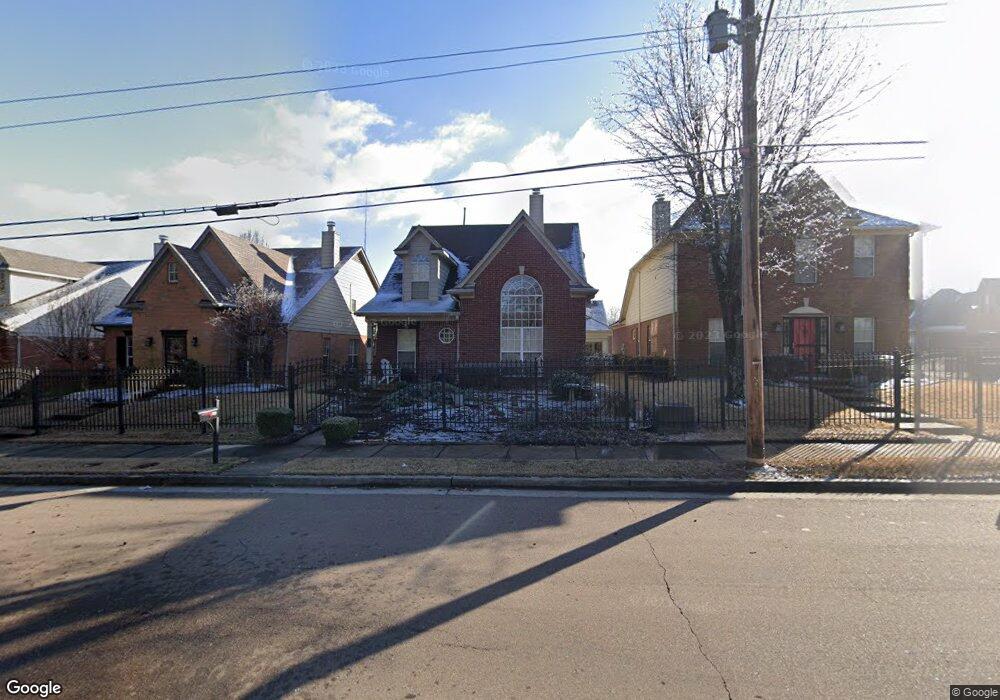
7439 Macon Rd Cordova, TN 38018
Cordova NeighborhoodEstimated Value: $243,000 - $254,000
3
Beds
2
Baths
2,363
Sq Ft
$104/Sq Ft
Est. Value
About This Home
This home is located at 7439 Macon Rd, Cordova, TN 38018 and is currently estimated at $246,750, approximately $104 per square foot. 7439 Macon Rd is a home located in Shelby County with nearby schools including Dexter Elementary School, Dexter Middle School, and Cordova High School.
Ownership History
Date
Name
Owned For
Owner Type
Purchase Details
Closed on
Sep 24, 2018
Sold by
Lampen Connie L
Bought by
Lampen Connie L and Connie L Lampen Revocable Trust
Current Estimated Value
Purchase Details
Closed on
Sep 15, 2010
Sold by
Lampen Connie L
Bought by
Connie L Lampen Revocable Trust
Purchase Details
Closed on
Jul 1, 2002
Sold by
Citifinancial Mtg Company Inc
Bought by
Lampen Connie L
Home Financials for this Owner
Home Financials are based on the most recent Mortgage that was taken out on this home.
Original Mortgage
$50,000
Outstanding Balance
$21,136
Interest Rate
6.67%
Estimated Equity
$225,614
Purchase Details
Closed on
Dec 14, 2001
Sold by
Mcminn Linda
Bought by
Citifinancial Mtg Company
Purchase Details
Closed on
Apr 28, 2000
Sold by
Glen Ashely Llc
Bought by
Mcminn Linda
Home Financials for this Owner
Home Financials are based on the most recent Mortgage that was taken out on this home.
Original Mortgage
$128,075
Interest Rate
10.9%
Mortgage Type
Balloon
Create a Home Valuation Report for This Property
The Home Valuation Report is an in-depth analysis detailing your home's value as well as a comparison with similar homes in the area
Home Values in the Area
Average Home Value in this Area
Purchase History
| Date | Buyer | Sale Price | Title Company |
|---|---|---|---|
| Lampen Connie L | -- | None Available | |
| Connie L Lampen Revocable Trust | -- | None Available | |
| Lampen Connie L | $132,000 | -- | |
| Citifinancial Mtg Company | $124,563 | -- | |
| Mcminn Linda | $150,875 | -- |
Source: Public Records
Mortgage History
| Date | Status | Borrower | Loan Amount |
|---|---|---|---|
| Open | Lampen Connie L | $50,000 | |
| Previous Owner | Mcminn Linda | $128,075 | |
| Closed | Mcminn Linda | $22,600 |
Source: Public Records
Tax History Compared to Growth
Tax History
| Year | Tax Paid | Tax Assessment Tax Assessment Total Assessment is a certain percentage of the fair market value that is determined by local assessors to be the total taxable value of land and additions on the property. | Land | Improvement |
|---|---|---|---|---|
| 2025 | $1,511 | $61,675 | $12,250 | $49,425 |
| 2024 | $1,511 | $44,575 | $8,000 | $36,575 |
| 2023 | $1,511 | $44,575 | $8,000 | $36,575 |
| 2022 | $1,511 | $44,575 | $8,000 | $36,575 |
| 2021 | $1,538 | $44,575 | $8,000 | $36,575 |
| 2020 | $1,347 | $33,250 | $8,000 | $25,250 |
| 2019 | $1,347 | $33,250 | $8,000 | $25,250 |
| 2018 | $1,347 | $33,250 | $8,000 | $25,250 |
| 2017 | $1,367 | $33,250 | $8,000 | $25,250 |
| 2016 | $1,304 | $29,850 | $0 | $0 |
| 2014 | $1,304 | $29,850 | $0 | $0 |
Source: Public Records
Map
Nearby Homes
- 909 Abbey Grove Ln
- 7444 Way
- 7420 Dal Whinnie Trail
- 7486 Dal Whinnie Trail
- 7327 Winterbrook Ln
- 7468 Links View Ln S
- 7494 Links View Ln S
- 7303 Winterbrook Ln
- 873 Winterfields Dr
- 7247 Winterbrook Ln
- 7273 Raleigh Lagrange Rd
- 984 Spinnaker Ln
- 7565 Wintergreen Ln
- 7659 Cordova Club Dr E
- 1224 Calebs Ridge Dr
- 7776 Grey Squirrel Cove
- 1220 Palmina Cove
- 1115 Hunters Green Cir S
- 7194 Charlton Way
- 1130 Hunters Green Cir S
- 7443 Macon Rd
- 7433 Macon Rd
- 7447 Macon Rd
- 7451 Macon Rd
- 7440 Glennmere Way
- 7436 Glennmere Way
- 7444 Glennmere Way
- 7432 Glennmere Way
- 933 Abbey Grove Ln
- 7448 Glennmere Way
- 7455 Macon Rd
- 929 Abbey Grove Ln
- 7452 Glennmere Way
- 925 Abbey Grove Ln
- 7456 Glennmere Way
- 921 Abbey Grove Ln
- 7439 Glennmere Way
- 7435 Glennmere Way
- 7443 Glennmere Way
- 7447 Glennmere Way