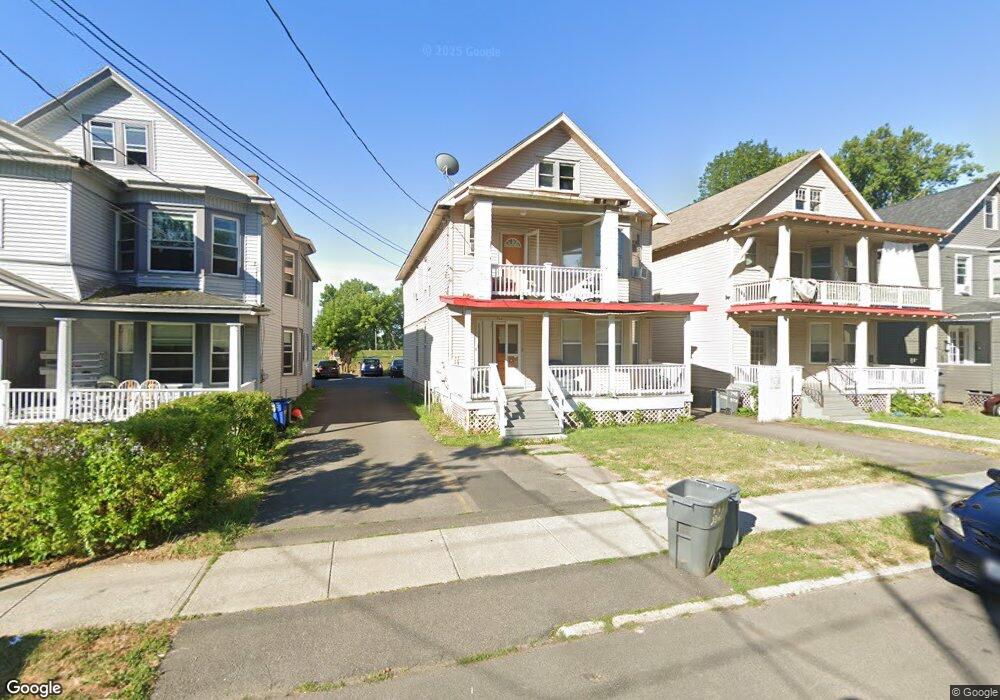
744 Myrtle Ave Unit 1 Albany, NY 12208
Pine Hills NeighborhoodEstimated Value: $286,444 - $636,000
4
Beds
1
Bath
1,500
Sq Ft
$254/Sq Ft
Est. Value
About This Home
This home is located at 744 Myrtle Ave Unit 1, Albany, NY 12208 and is currently estimated at $380,361, approximately $253 per square foot. 744 Myrtle Ave Unit 1 is a home located in Albany County with nearby schools including Pine Hills Elementary School, Stephen And Harriet Myers Middle School, and Albany High School.
Ownership History
Date
Name
Owned For
Owner Type
Purchase Details
Closed on
Jul 22, 2024
Sold by
Rec Enterprises Llc
Bought by
Roy Ripon and Das Shrabanee
Current Estimated Value
Home Financials for this Owner
Home Financials are based on the most recent Mortgage that was taken out on this home.
Original Mortgage
$206,250
Outstanding Balance
$202,466
Interest Rate
6.95%
Mortgage Type
New Conventional
Estimated Equity
$177,895
Purchase Details
Closed on
Aug 11, 2015
Sold by
Fischler Andrew B
Bought by
Rec Enterprises Llc
Purchase Details
Closed on
Apr 6, 1999
Sold by
Mortgage Beneficial Corp
Bought by
Fischler Andrew B
Home Financials for this Owner
Home Financials are based on the most recent Mortgage that was taken out on this home.
Original Mortgage
$42,750
Interest Rate
6.92%
Mortgage Type
Purchase Money Mortgage
Purchase Details
Closed on
Jun 26, 1998
Create a Home Valuation Report for This Property
The Home Valuation Report is an in-depth analysis detailing your home's value as well as a comparison with similar homes in the area
Home Values in the Area
Average Home Value in this Area
Purchase History
| Date | Buyer | Sale Price | Title Company |
|---|---|---|---|
| Roy Ripon | $275,000 | Catic Title | |
| Rec Enterprises Llc | $775,000 | None Available | |
| Fischler Andrew B | $48,500 | -- | |
| Fischler Andrew B | $48,500 | -- | |
| -- | $24,900 | -- |
Source: Public Records
Mortgage History
| Date | Status | Borrower | Loan Amount |
|---|---|---|---|
| Open | Roy Ripon | $206,250 | |
| Previous Owner | Fischler Andrew B | $42,750 |
Source: Public Records
Tax History Compared to Growth
Tax History
| Year | Tax Paid | Tax Assessment Tax Assessment Total Assessment is a certain percentage of the fair market value that is determined by local assessors to be the total taxable value of land and additions on the property. | Land | Improvement |
|---|---|---|---|---|
| 2024 | $8,670 | $315,000 | $63,000 | $252,000 |
| 2023 | $6,251 | $154,000 | $30,800 | $123,200 |
| 2022 | $6,819 | $154,000 | $30,800 | $123,200 |
| 2021 | $6,806 | $154,000 | $30,800 | $123,200 |
| 2020 | $6,119 | $154,000 | $30,800 | $123,200 |
| 2019 | $6,063 | $154,000 | $30,800 | $123,200 |
| 2018 | $6,715 | $154,000 | $30,800 | $123,200 |
| 2017 | $3,445 | $154,000 | $30,800 | $123,200 |
| 2016 | $5,680 | $154,000 | $30,800 | $123,200 |
| 2015 | $5,689 | $155,000 | $31,600 | $123,400 |
| 2014 | -- | $155,000 | $31,600 | $123,400 |
Source: Public Records
Map
Nearby Homes
- 744 Myrtle Ave
- 742 Myrtle Ave
- 746 Myrtle Ave
- 748 Myrtle Ave
- 738 Myrtle Ave
- 750 Myrtle Ave
- 752 Myrtle Ave
- 752 Myrtle Ave
- 754 Myrtle Ave
- 734 Myrtle Ave
- 758 Myrtle Ave
- 726 Myrtle Ave
- 726 Myrtle Ave Unit 1
- 730 Myrtle Ave
- 760 Myrtle Ave
- 741 Myrtle Ave
- 743 Myrtle Ave
- 725 Myrtle Ave
- 764 Myrtle Ave
- 723 Myrtle Ave