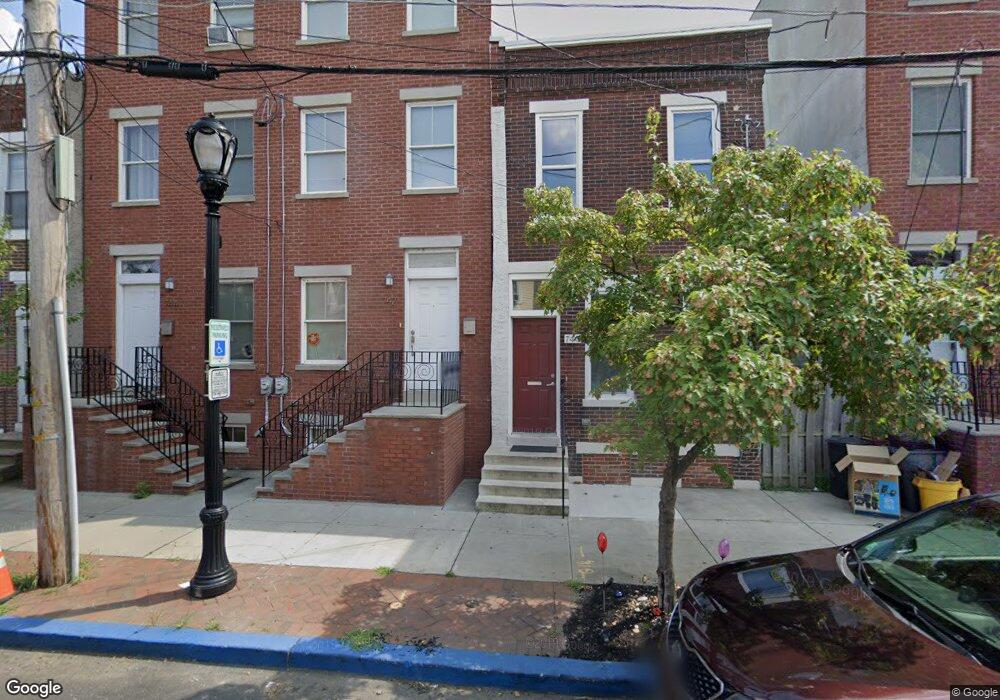
744 New St Camden, NJ 08103
Lanning Square NeighborhoodEstimated Value: $202,308 - $402,000
--
Bed
--
Bath
1,599
Sq Ft
$172/Sq Ft
Est. Value
About This Home
This home is located at 744 New St, Camden, NJ 08103 and is currently estimated at $274,327, approximately $171 per square foot. 744 New St is a home with nearby schools including Camden High School, Hope Community Charter School, and Leap Academy University Charter School.
Ownership History
Date
Name
Owned For
Owner Type
Purchase Details
Closed on
Oct 29, 2019
Sold by
Gill David and Johnson Warrenetta
Bought by
Gill David
Current Estimated Value
Purchase Details
Closed on
Mar 27, 2014
Sold by
Coopers Hill Town Homes Llc
Bought by
Gill David S and Gill Warrenetta J
Home Financials for this Owner
Home Financials are based on the most recent Mortgage that was taken out on this home.
Original Mortgage
$162,700
Outstanding Balance
$123,822
Interest Rate
4.37%
Mortgage Type
New Conventional
Estimated Equity
$150,505
Create a Home Valuation Report for This Property
The Home Valuation Report is an in-depth analysis detailing your home's value as well as a comparison with similar homes in the area
Home Values in the Area
Average Home Value in this Area
Purchase History
| Date | Buyer | Sale Price | Title Company |
|---|---|---|---|
| Gill David | -- | None Available | |
| Gill David S | $162,700 | None Available |
Source: Public Records
Mortgage History
| Date | Status | Borrower | Loan Amount |
|---|---|---|---|
| Open | Gill David S | $162,700 |
Source: Public Records
Tax History Compared to Growth
Tax History
| Year | Tax Paid | Tax Assessment Tax Assessment Total Assessment is a certain percentage of the fair market value that is determined by local assessors to be the total taxable value of land and additions on the property. | Land | Improvement |
|---|---|---|---|---|
| 2025 | $5,764 | $162,700 | $6,100 | $156,600 |
| 2024 | $5,572 | $162,700 | $6,100 | $156,600 |
| 2023 | $5,572 | $162,700 | $6,100 | $156,600 |
| 2022 | $5,468 | $162,700 | $6,100 | $156,600 |
| 2021 | $5,449 | $162,700 | $6,100 | $156,600 |
| 2020 | $5,174 | $162,700 | $6,100 | $156,600 |
| 2019 | $186 | $162,700 | $6,100 | $156,600 |
| 2018 | $185 | $162,700 | $6,100 | $156,600 |
| 2017 | $180 | $162,700 | $6,100 | $156,600 |
| 2016 | $175 | $162,700 | $6,100 | $156,600 |
| 2015 | $168 | $162,700 | $6,100 | $156,600 |
| 2014 | $164 | $6,100 | $6,100 | $0 |
Source: Public Records
Map
Nearby Homes
- 711 Berkley St
- 700 New St Unit 308
- 601 Berkley St
- 715 S 8th St
- 803 Princeton Ave
- 746 Pine St
- 724 Spruce St
- 718 Spruce St
- 513 Benson St
- 917 S 8th St
- 918 Mount Ephraim Ave
- 418 Benson St
- 764 Mount Vernon St
- 507 S 4th St
- 1153 Cooper St
- 321 Washington St
- 318 Clinton St
- 107 N 6th St
- 449 S 6th St
- 1003 Langham Ave