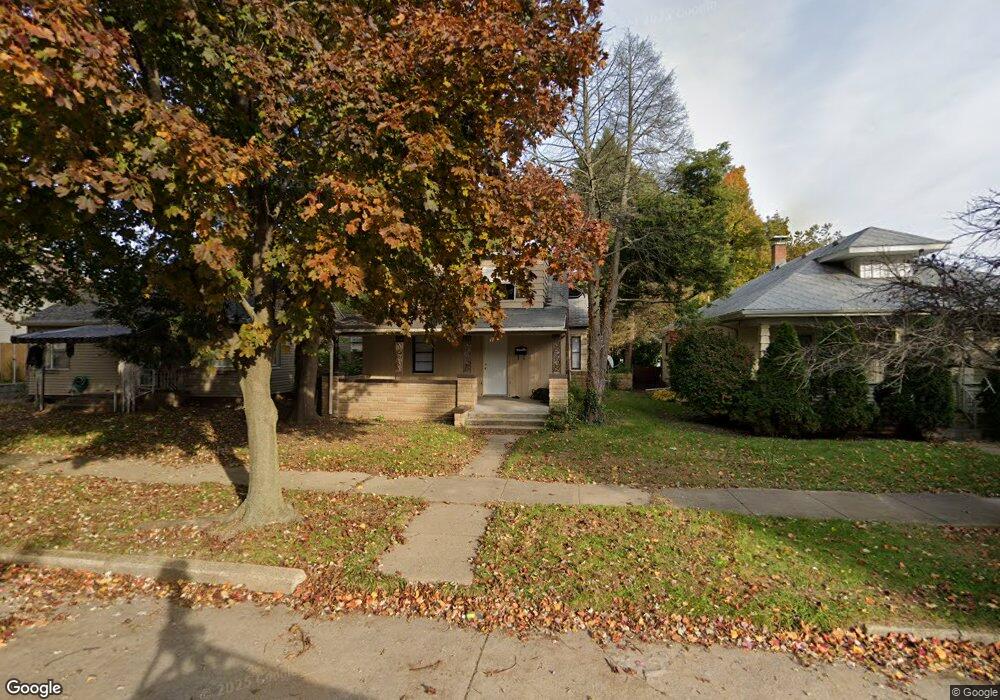
744 S 24th St South Bend, IN 46615
River Park NeighborhoodEstimated Value: $123,000 - $137,000
3
Beds
1
Bath
1,604
Sq Ft
$81/Sq Ft
Est. Value
About This Home
This home is located at 744 S 24th St, South Bend, IN 46615 and is currently estimated at $129,333, approximately $80 per square foot. 744 S 24th St is a home located in St. Joseph County with nearby schools including Cora B. Darling Elementary School, Nuner Fine Arts Academy, and Clay Intermediate Center.
Ownership History
Date
Name
Owned For
Owner Type
Purchase Details
Closed on
Jul 21, 2021
Sold by
Homeworks Funding Group Llc
Bought by
Red Bird Realty Solutions Llc
Current Estimated Value
Home Financials for this Owner
Home Financials are based on the most recent Mortgage that was taken out on this home.
Original Mortgage
$515,200
Outstanding Balance
$468,176
Interest Rate
3%
Mortgage Type
Commercial
Estimated Equity
-$338,843
Purchase Details
Closed on
May 29, 2008
Sold by
Damico Anthony
Bought by
Homeworks Funding Group Llc
Purchase Details
Closed on
Mar 27, 2008
Sold by
Depalma William
Bought by
Damico Anthony
Purchase Details
Closed on
Oct 19, 2006
Sold by
Hanna Charles
Bought by
Wells Fargo Bank Na
Create a Home Valuation Report for This Property
The Home Valuation Report is an in-depth analysis detailing your home's value as well as a comparison with similar homes in the area
Home Values in the Area
Average Home Value in this Area
Purchase History
| Date | Buyer | Sale Price | Title Company |
|---|---|---|---|
| Red Bird Realty Solutions Llc | -- | Fidelity National Title | |
| Homeworks Funding Group Llc | -- | None Available | |
| Damico Anthony | $35,000 | None Available | |
| Wells Fargo Bank Na | $33,925 | None Available |
Source: Public Records
Mortgage History
| Date | Status | Borrower | Loan Amount |
|---|---|---|---|
| Open | Red Bird Realty Solutions Llc | $515,200 |
Source: Public Records
Tax History Compared to Growth
Tax History
| Year | Tax Paid | Tax Assessment Tax Assessment Total Assessment is a certain percentage of the fair market value that is determined by local assessors to be the total taxable value of land and additions on the property. | Land | Improvement |
|---|---|---|---|---|
| 2024 | $1,628 | $71,600 | $5,900 | $65,700 |
| 2023 | $1,596 | $66,500 | $5,800 | $60,700 |
| 2022 | $1,639 | $66,500 | $5,800 | $60,700 |
| 2021 | $1,486 | $60,100 | $4,500 | $55,600 |
| 2020 | $1,588 | $64,400 | $4,500 | $59,900 |
| 2019 | $925 | $43,000 | $4,000 | $39,000 |
| 2018 | $1,074 | $43,200 | $4,000 | $39,200 |
| 2017 | $1,104 | $42,600 | $4,000 | $38,600 |
| 2016 | $1,127 | $42,600 | $4,000 | $38,600 |
| 2014 | $1,095 | $41,900 | $4,000 | $37,900 |
Source: Public Records
Map
Nearby Homes
- 815 S 26th St
- 806 S 26th St
- 634 S 26th St
- 513 S 26th St
- 537 S 27th St
- 510 S Ironwood Dr
- 525 S 28th St
- 1017 S 23rd St
- 1111 S 27th St
- 2001 E Jefferson Blvd
- 1603 Hoover Ave
- 734 S 33rd St
- 3312 Mishawaka Ave
- 137 Monmoor Ave
- 3312 E Jefferson Square
- 715 S 35th St
- 930 S 34th St
- 1105 S 35th St
- 1510 Sunnymede Ave
- 222 N Tuxedo Dr