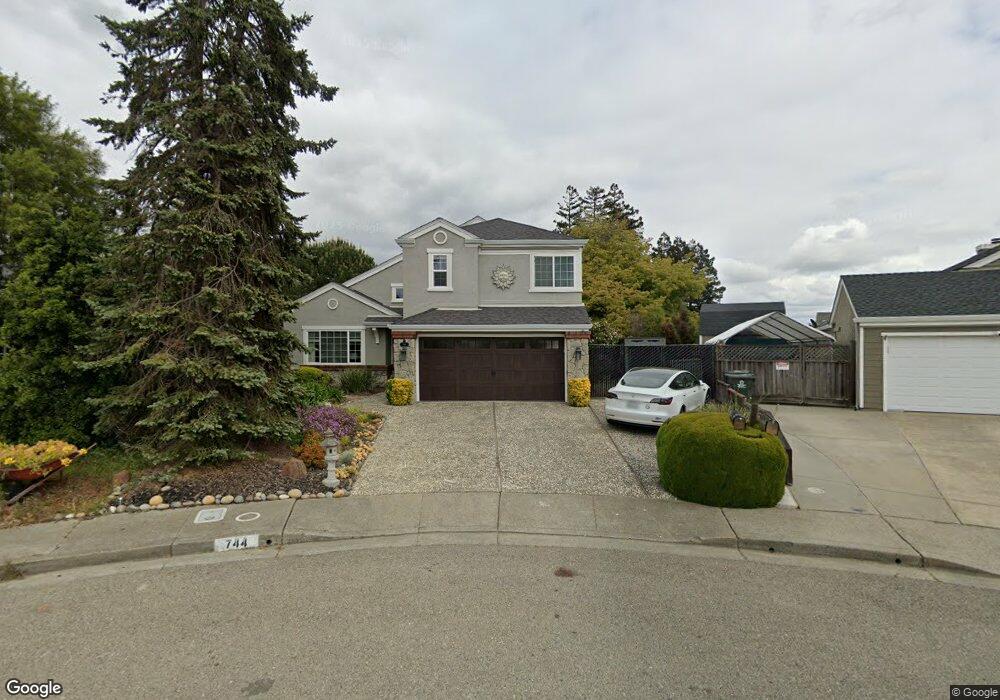
744 Tulip Ct Benicia, CA 94510
Estimated Value: $887,000 - $950,000
4
Beds
3
Baths
1,964
Sq Ft
$462/Sq Ft
Est. Value
About This Home
This home is located at 744 Tulip Ct, Benicia, CA 94510 and is currently estimated at $908,204, approximately $462 per square foot. 744 Tulip Ct is a home located in Solano County with nearby schools including Matthew Turner Elementary School, Benicia Middle School, and Benicia High School.
Ownership History
Date
Name
Owned For
Owner Type
Purchase Details
Closed on
Jan 28, 2005
Sold by
Forbes Ronald J and Forbes Cathy P
Bought by
Forbes Ronald J and Forbes Cathy P
Current Estimated Value
Home Financials for this Owner
Home Financials are based on the most recent Mortgage that was taken out on this home.
Original Mortgage
$63,450
Outstanding Balance
$32,229
Interest Rate
5.74%
Mortgage Type
Stand Alone Second
Estimated Equity
$875,975
Purchase Details
Closed on
Dec 26, 1996
Sold by
Parnow Thomas G and Parnow Lisa A
Bought by
Forbes Ronald J and Forbes Cathy P
Home Financials for this Owner
Home Financials are based on the most recent Mortgage that was taken out on this home.
Original Mortgage
$180,750
Outstanding Balance
$19,239
Interest Rate
7.53%
Estimated Equity
$888,965
Create a Home Valuation Report for This Property
The Home Valuation Report is an in-depth analysis detailing your home's value as well as a comparison with similar homes in the area
Home Values in the Area
Average Home Value in this Area
Purchase History
| Date | Buyer | Sale Price | Title Company |
|---|---|---|---|
| Forbes Ronald J | -- | First American Title Co | |
| Forbes Ronald J | $245,500 | Chicago Title Co |
Source: Public Records
Mortgage History
| Date | Status | Borrower | Loan Amount |
|---|---|---|---|
| Open | Forbes Ronald J | $63,450 | |
| Open | Forbes Ronald J | $180,750 |
Source: Public Records
Tax History Compared to Growth
Tax History
| Year | Tax Paid | Tax Assessment Tax Assessment Total Assessment is a certain percentage of the fair market value that is determined by local assessors to be the total taxable value of land and additions on the property. | Land | Improvement |
|---|---|---|---|---|
| 2025 | $4,741 | $399,517 | $122,152 | $277,365 |
| 2024 | $4,741 | $391,684 | $119,757 | $271,927 |
| 2023 | $4,628 | $384,005 | $117,409 | $266,596 |
| 2022 | $4,543 | $376,476 | $115,107 | $261,369 |
| 2021 | $4,452 | $369,095 | $112,850 | $256,245 |
| 2020 | $4,394 | $365,311 | $111,693 | $253,618 |
| 2019 | $4,319 | $358,149 | $109,503 | $248,646 |
| 2018 | $4,210 | $351,127 | $107,356 | $243,771 |
| 2017 | $4,115 | $344,243 | $105,251 | $238,992 |
| 2016 | $4,143 | $337,494 | $103,188 | $234,306 |
| 2015 | $4,041 | $332,426 | $101,639 | $230,787 |
| 2014 | $3,993 | $325,916 | $99,649 | $226,267 |
Source: Public Records
Map
Nearby Homes