Estimated Value: $141,000 - $168,000
3
Beds
1
Bath
1,075
Sq Ft
$145/Sq Ft
Est. Value
About This Home
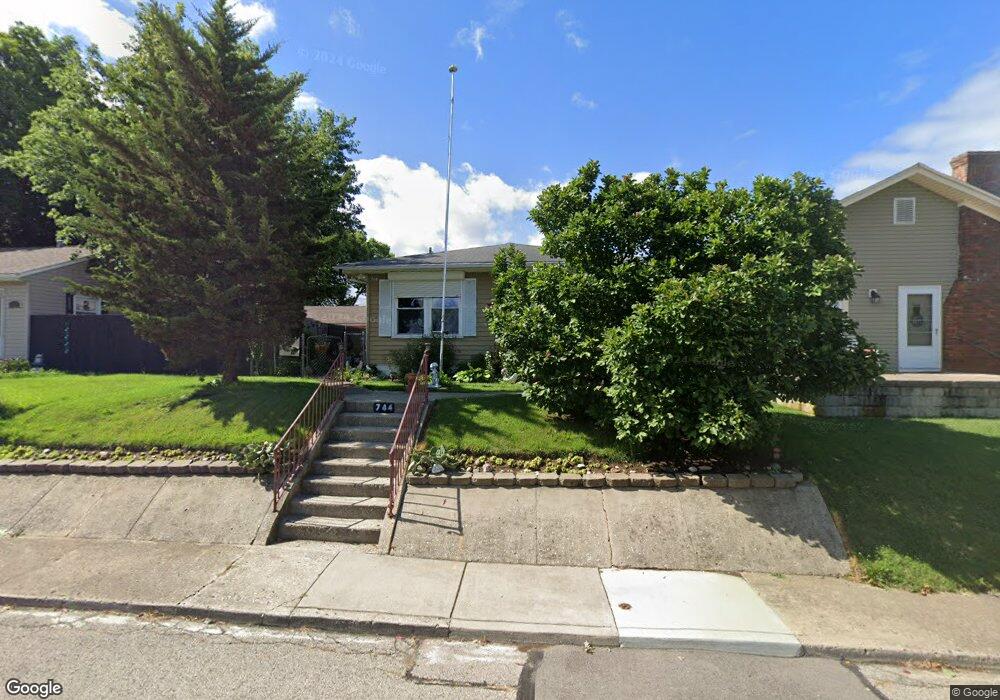
This home is located at 744 Vine St, Piqua, OH 45356 and is currently estimated at $156,153, approximately $145 per square foot. 744 Vine St is a home located in Miami County with nearby schools including Piqua Central Intermediate School, Springcreek Primary School, and Piqua Junior High School.
Ownership History
Date
Name
Owned For
Owner Type
Purchase Details
Closed on
Aug 7, 2006
Sold by
Wglb Inc
Bought by
Faehl Carl J and Faehl Cynthia L
Current Estimated Value
Home Financials for this Owner
Home Financials are based on the most recent Mortgage that was taken out on this home.
Original Mortgage
$89,000
Outstanding Balance
$53,608
Interest Rate
6.82%
Mortgage Type
New Conventional
Estimated Equity
$102,545
Purchase Details
Closed on
Apr 21, 2006
Sold by
Basil Eric L
Bought by
Wglb Inc
Purchase Details
Closed on
Sep 28, 1999
Sold by
Sweetman Eric
Bought by
Basil Eric L
Purchase Details
Closed on
Aug 22, 1991
Bought by
Wheeler Alvin R Trustee
Create a Home Valuation Report for This Property
The Home Valuation Report is an in-depth analysis detailing your home's value as well as a comparison with similar homes in the area
Home Values in the Area
Average Home Value in this Area
Purchase History
| Date | Buyer | Sale Price | Title Company |
|---|---|---|---|
| Faehl Carl J | $89,000 | -- | |
| Wglb Inc | $66,000 | -- | |
| Basil Eric L | $82,900 | -- | |
| Wheeler Alvin R Trustee | -- | -- |
Source: Public Records
Mortgage History
| Date | Status | Borrower | Loan Amount |
|---|---|---|---|
| Open | Basil Eric L | $89,000 |
Source: Public Records
Tax History
| Year | Tax Paid | Tax Assessment Tax Assessment Total Assessment is a certain percentage of the fair market value that is determined by local assessors to be the total taxable value of land and additions on the property. | Land | Improvement |
|---|---|---|---|---|
| 2024 | $1,687 | $37,380 | $7,700 | $29,680 |
| 2023 | $1,536 | $37,380 | $7,700 | $29,680 |
| 2022 | $1,563 | $37,380 | $7,700 | $29,680 |
| 2021 | $1,314 | $28,740 | $5,920 | $22,820 |
| 2020 | $1,288 | $28,740 | $5,920 | $22,820 |
| 2019 | $1,295 | $28,740 | $5,920 | $22,820 |
| 2018 | $1,154 | $24,470 | $6,160 | $18,310 |
| 2017 | $1,169 | $24,470 | $6,160 | $18,310 |
| 2016 | $1,156 | $24,470 | $6,160 | $18,310 |
| 2015 | $1,137 | $23,530 | $5,920 | $17,610 |
| 2014 | $1,137 | $23,530 | $5,920 | $17,610 |
| 2013 | $1,141 | $23,530 | $5,920 | $17,610 |
Source: Public Records
Map
Nearby Homes
- 614 Cherry St
- 1514 Nicklin Ave
- 1507 Nicklin Ave
- 1307 Walker St
- 1115 Madison Ave
- 505 Scott St
- 1102 Fountain Blvd
- 802 Washington Ave
- 454 Riverside Dr
- 735 Park Ave
- 1062 Boone St
- 419 Riverside Dr
- 103 Lakewood Place
- 924 W North St
- 651 Boone St
- 630 Boone St
- 10175 Piqua Lockington Rd
- 412 Camp St
- 825 W Greene St
- 522 W North St
Your Personal Tour Guide
Ask me questions while you tour the home.