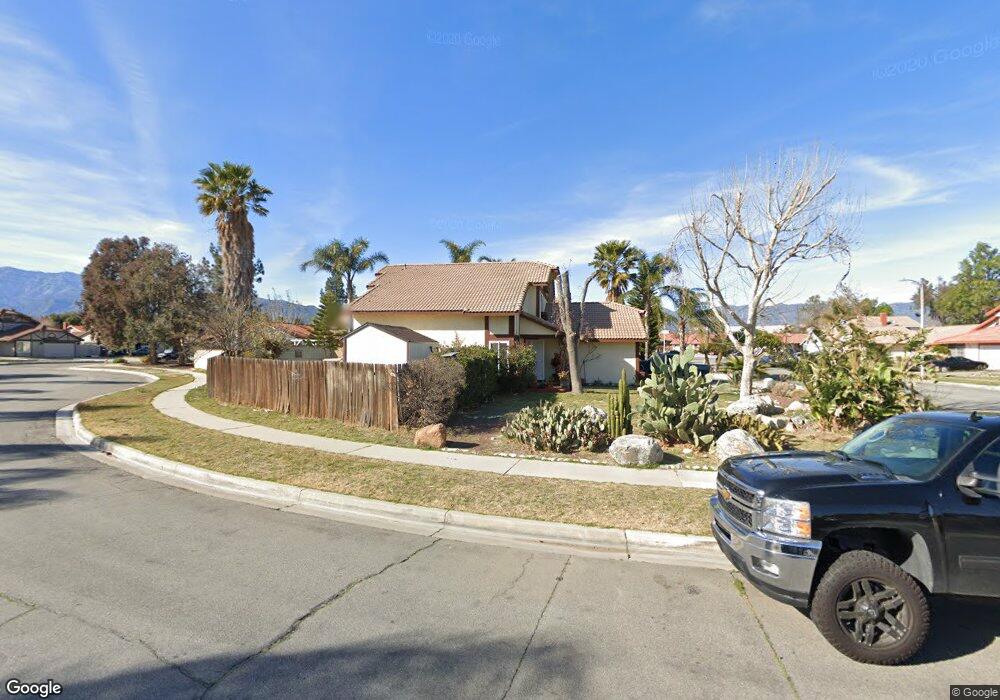
7440 Grace St Fontana, CA 92336
Estimated Value: $563,000 - $636,656
3
Beds
3
Baths
1,527
Sq Ft
$403/Sq Ft
Est. Value
About This Home
This home is located at 7440 Grace St, Fontana, CA 92336 and is currently estimated at $615,164, approximately $402 per square foot. 7440 Grace St is a home located in San Bernardino County with nearby schools including Locust Elementary School, Alder Middle School, and Fontana A. B. Miller High School.
Ownership History
Date
Name
Owned For
Owner Type
Purchase Details
Closed on
Feb 12, 2020
Sold by
Aviles Joe and Aviles Delia Hernandez
Bought by
Luna Daniel and Maciel Sabrina Amelia
Current Estimated Value
Home Financials for this Owner
Home Financials are based on the most recent Mortgage that was taken out on this home.
Original Mortgage
$170,000
Outstanding Balance
$149,944
Interest Rate
3.4%
Mortgage Type
New Conventional
Estimated Equity
$465,220
Purchase Details
Closed on
Feb 23, 2017
Sold by
Hernandez Aviles Joe and Hernandez Aviles Delia
Bought by
Hernandez Aviles Joe and Hernandez Aviles Delia
Home Financials for this Owner
Home Financials are based on the most recent Mortgage that was taken out on this home.
Original Mortgage
$76,389
Interest Rate
4.09%
Mortgage Type
VA
Purchase Details
Closed on
Jun 16, 2015
Sold by
Hernandez Aviles Joe and Hernandez Aviles Delia
Bought by
The Aviles Living Trust
Create a Home Valuation Report for This Property
The Home Valuation Report is an in-depth analysis detailing your home's value as well as a comparison with similar homes in the area
Home Values in the Area
Average Home Value in this Area
Purchase History
| Date | Buyer | Sale Price | Title Company |
|---|---|---|---|
| Luna Daniel | $300,000 | First American Title Company | |
| Hernandez Aviles Joe | -- | Fidelity Natl Title Group | |
| The Aviles Living Trust | -- | None Available |
Source: Public Records
Mortgage History
| Date | Status | Borrower | Loan Amount |
|---|---|---|---|
| Open | Luna Daniel | $170,000 | |
| Previous Owner | Hernandez Aviles Joe | $76,389 |
Source: Public Records
Tax History Compared to Growth
Tax History
| Year | Tax Paid | Tax Assessment Tax Assessment Total Assessment is a certain percentage of the fair market value that is determined by local assessors to be the total taxable value of land and additions on the property. | Land | Improvement |
|---|---|---|---|---|
| 2025 | $5,468 | $442,927 | $131,237 | $311,690 |
| 2024 | $5,468 | $434,242 | $128,664 | $305,578 |
| 2023 | $4,884 | $425,727 | $126,141 | $299,586 |
| 2022 | $4,848 | $417,380 | $123,668 | $293,712 |
| 2021 | $4,784 | $409,196 | $121,243 | $287,953 |
| 2020 | $2,881 | $238,455 | $59,550 | $178,905 |
| 2019 | $2,803 | $233,779 | $58,382 | $175,397 |
| 2018 | $2,821 | $229,195 | $57,237 | $171,958 |
| 2017 | $2,779 | $224,701 | $56,115 | $168,586 |
| 2016 | $2,711 | $220,295 | $55,015 | $165,280 |
| 2015 | $2,675 | $216,986 | $54,189 | $162,797 |
| 2014 | $2,727 | $212,736 | $53,128 | $159,608 |
Source: Public Records
Map
Nearby Homes
- 7724 Myles Ct
- 17806 Terry St
- 7835 Laurel Ave
- 18281 Montgomery Ave
- 17571 Shamrock Ave
- 7398 N Maple Ave
- 7852 Grace Ave
- 7740 Lombardy Ave
- 956 N Sandalwood Ave
- 7870 Williams Rd
- 7925 Spohn Ave
- 7936 Alder Ave
- 17548 Court St
- 17562 Court St
- 645 N Maple Ave
- 17848 17858 Foothill Blvd
- 8019 Alder Ave
- 18045 Foothill Blvd
- 7738 Encinitas Ave
- 17341 Fairfax St
- 7430 Grace St
- 7435 Ferndale Ave
- 7420 Grace St
- 7445 Grace St
- 17955 San Jacinto Ave
- 17965 San Jacinto Ave
- 17945 San Jacinto Ave
- 7435 Grace St
- 7455 Grace St
- 17935 San Jacinto Ave
- 7425 Ferndale Ave
- 17975 San Jacinto Ave
- 7410 Grace St
- 7425 Grace St
- 17985 San Jacinto Ave
- 17925 San Jacinto Ave
- 7415 Ferndale Ave
- 7415 Grace St
- 7430 Ferndale Ave
- 7400 Grace St