7440 Keely Run Ooltewah, TN 37363
Estimated Value: $525,560 - $621,000
4
Beds
3
Baths
2,510
Sq Ft
$226/Sq Ft
Est. Value
About This Home
This home is located at 7440 Keely Run, Ooltewah, TN 37363 and is currently estimated at $567,890, approximately $226 per square foot. 7440 Keely Run is a home located in Hamilton County with nearby schools including Ooltewah Elementary School, Hunter Middle School, and Ooltewah High School.
Ownership History
Date
Name
Owned For
Owner Type
Purchase Details
Closed on
Sep 11, 2020
Sold by
Rowland Development Group Llc
Bought by
Heinemann Stefan and Brandmueller Asita Flora
Current Estimated Value
Home Financials for this Owner
Home Financials are based on the most recent Mortgage that was taken out on this home.
Original Mortgage
$50,000
Outstanding Balance
$44,068
Interest Rate
2.9%
Mortgage Type
Commercial
Estimated Equity
$523,822
Purchase Details
Closed on
Aug 8, 2014
Sold by
Blue Point One Llc
Bought by
Rowland Development Group Llc
Home Financials for this Owner
Home Financials are based on the most recent Mortgage that was taken out on this home.
Original Mortgage
$236,000
Interest Rate
4.19%
Mortgage Type
Construction
Purchase Details
Closed on
Jun 27, 2013
Sold by
Buster & Brown Properties Llc
Bought by
Blue Point One Llc
Create a Home Valuation Report for This Property
The Home Valuation Report is an in-depth analysis detailing your home's value as well as a comparison with similar homes in the area
Home Values in the Area
Average Home Value in this Area
Purchase History
| Date | Buyer | Sale Price | Title Company |
|---|---|---|---|
| Heinemann Stefan | $309,000 | None Available | |
| Rowland Development Group Llc | -- | Pioneer Title Agency Inc | |
| Blue Point One Llc | $90,750 | None Available |
Source: Public Records
Mortgage History
| Date | Status | Borrower | Loan Amount |
|---|---|---|---|
| Open | Heinemann Stefan | $50,000 | |
| Previous Owner | Rowland Development Group Llc | $236,000 |
Source: Public Records
Tax History
| Year | Tax Paid | Tax Assessment Tax Assessment Total Assessment is a certain percentage of the fair market value that is determined by local assessors to be the total taxable value of land and additions on the property. | Land | Improvement |
|---|---|---|---|---|
| 2025 | $1,991 | $131,350 | $0 | $0 |
| 2024 | $1,996 | $89,225 | $0 | $0 |
| 2023 | $1,996 | $89,225 | $0 | $0 |
| 2022 | $1,996 | $89,225 | $0 | $0 |
| 2021 | $1,996 | $89,225 | $0 | $0 |
| 2020 | $2,238 | $80,950 | $0 | $0 |
| 2019 | $2,238 | $80,950 | $0 | $0 |
| 2018 | $2,238 | $80,950 | $0 | $0 |
| 2017 | $2,238 | $80,950 | $0 | $0 |
| 2016 | $1,965 | $0 | $0 | $0 |
| 2015 | $1,569 | $71,075 | $0 | $0 |
| 2014 | $277 | $0 | $0 | $0 |
Source: Public Records
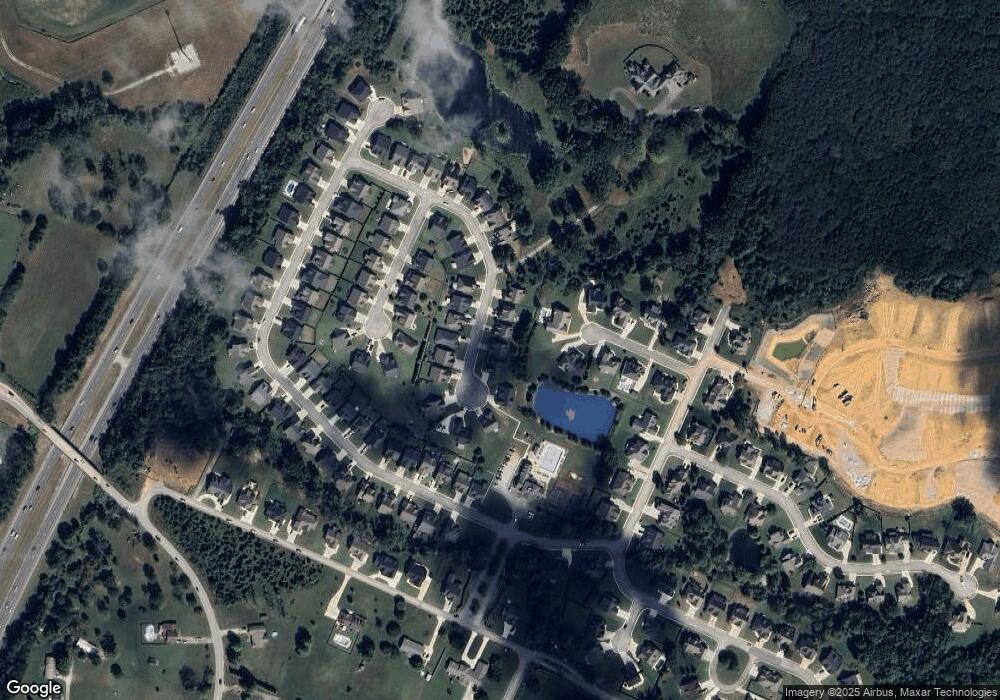
Map
Nearby Homes
- 8975 Silver Maple Dr
- 8870 Silver Maple Dr
- 8906 Silver Maple Dr
- 7206 Sylar Rd
- 7219 Sylar Rd
- 8860 Knolling Loop
- 8852 Knolling Loop
- 8918 Knolling Loop
- 8930 Knolling Loop
- 8942 Knolling Loop
- 9089 Knolling Loop
- 8671 Blanche Rd
- Waterford Plan at Bainbridge
- Belvoir Plan at Bainbridge
- Lynden Plan at Bainbridge
- Peachtree Plan at Bainbridge
- Callaway Plan at Bainbridge
- Emory Plan at Bainbridge
- Laurel Plan at Bainbridge
- Riverbirch Plan at Bainbridge