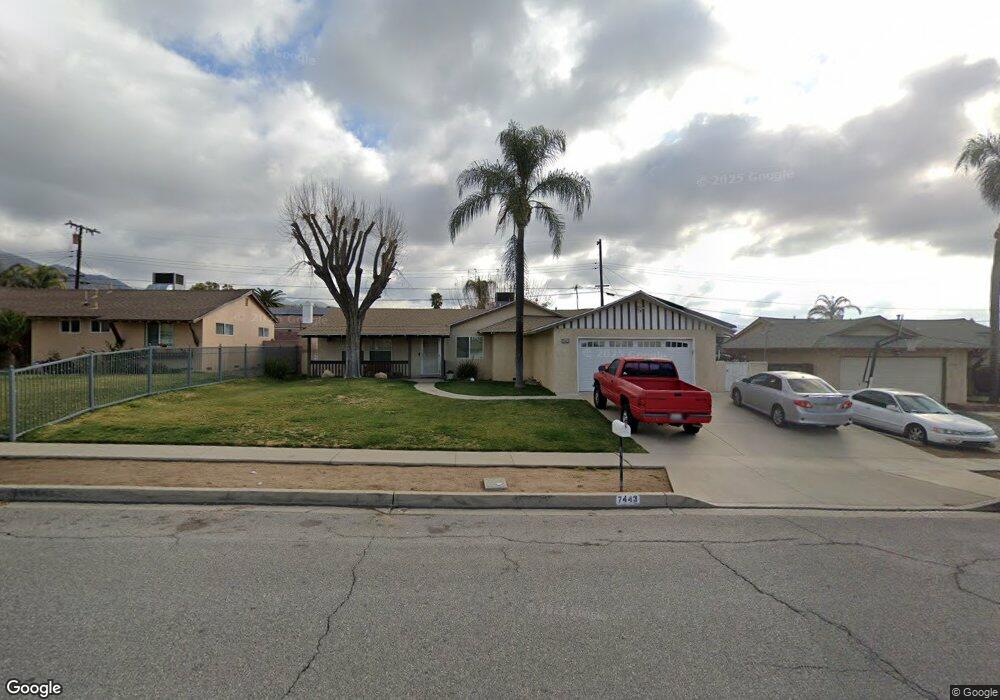
7443 Seine Ave Highland, CA 92346
East Highlands NeighborhoodEstimated Value: $470,860 - $544,000
3
Beds
2
Baths
1,271
Sq Ft
$404/Sq Ft
Est. Value
About This Home
This home is located at 7443 Seine Ave, Highland, CA 92346 and is currently estimated at $513,965, approximately $404 per square foot. 7443 Seine Ave is a home located in San Bernardino County with nearby schools including Thompson Elementary School, Serrano Middle School, and San Gorgonio High School.
Ownership History
Date
Name
Owned For
Owner Type
Purchase Details
Closed on
May 2, 2017
Sold by
Joseph Theophilus Isdora
Bought by
Ortega Uriel and Ortega Erika
Current Estimated Value
Home Financials for this Owner
Home Financials are based on the most recent Mortgage that was taken out on this home.
Original Mortgage
$255,290
Outstanding Balance
$210,952
Interest Rate
3.87%
Mortgage Type
FHA
Estimated Equity
$303,013
Purchase Details
Closed on
Jan 23, 2013
Sold by
Bradley Joseph Theophilus I
Bought by
Joseph Theophilus I and Bradley Phyllis M
Home Financials for this Owner
Home Financials are based on the most recent Mortgage that was taken out on this home.
Original Mortgage
$188,689
Interest Rate
3.33%
Mortgage Type
FHA
Purchase Details
Closed on
Mar 10, 2008
Sold by
Rodriguez Consuelo
Bought by
Wells Fargo Bank Na and Impac Secured Assets Corp Mortgage Pass
Home Financials for this Owner
Home Financials are based on the most recent Mortgage that was taken out on this home.
Original Mortgage
$201,897
Interest Rate
5.72%
Mortgage Type
FHA
Purchase Details
Closed on
Feb 22, 2008
Sold by
Wells Fargo Bank Na
Bought by
Joseph Theophilus I and Bradley Phyllis M
Home Financials for this Owner
Home Financials are based on the most recent Mortgage that was taken out on this home.
Original Mortgage
$201,897
Interest Rate
5.72%
Mortgage Type
FHA
Purchase Details
Closed on
Apr 12, 2007
Sold by
Rodriguez Consuelo
Bought by
Wells Fargo Bank Na and Impac Secured Assets Corp Mortgage Pass
Purchase Details
Closed on
Nov 14, 2002
Sold by
Helo Aysar
Bought by
Rodriguez Consuelo
Home Financials for this Owner
Home Financials are based on the most recent Mortgage that was taken out on this home.
Original Mortgage
$158,512
Interest Rate
6.06%
Mortgage Type
FHA
Purchase Details
Closed on
Jul 2, 2002
Sold by
Parkerson Donald R
Bought by
Helo Aysar
Purchase Details
Closed on
Nov 21, 1997
Sold by
Parkerson Donald R and Mccoy Kristy E
Bought by
Parkerson Donald R and Parkerson Kristy E
Home Financials for this Owner
Home Financials are based on the most recent Mortgage that was taken out on this home.
Original Mortgage
$35,000
Interest Rate
7.19%
Purchase Details
Closed on
Jun 3, 1993
Sold by
Clairmont John N
Bought by
Parkerson Donald R and Mccoy Kristy E
Home Financials for this Owner
Home Financials are based on the most recent Mortgage that was taken out on this home.
Original Mortgage
$93,781
Interest Rate
6.94%
Mortgage Type
FHA
Create a Home Valuation Report for This Property
The Home Valuation Report is an in-depth analysis detailing your home's value as well as a comparison with similar homes in the area
Home Values in the Area
Average Home Value in this Area
Purchase History
| Date | Buyer | Sale Price | Title Company |
|---|---|---|---|
| Ortega Uriel | $260,000 | Wfg National Title Company | |
| Joseph Theophilus I | -- | None Available | |
| Wells Fargo Bank Na | $321,847 | Accommodation | |
| Joseph Theophilus I | $205,000 | First American Title Ins Co | |
| Wells Fargo Bank Na | $321,847 | Lsi Title | |
| Rodriguez Consuelo | $162,000 | Chicago Title Co | |
| Helo Aysar | $102,000 | -- | |
| Parkerson Donald R | -- | Southland Title Corporation | |
| Parkerson Donald R | $94,000 | First American Title Insuran |
Source: Public Records
Mortgage History
| Date | Status | Borrower | Loan Amount |
|---|---|---|---|
| Open | Ortega Uriel | $255,290 | |
| Previous Owner | Joseph Theophilus I | $188,689 | |
| Previous Owner | Joseph Theophilus I | $201,897 | |
| Previous Owner | Rodriguez Consuelo | $158,512 | |
| Previous Owner | Parkerson Donald R | $35,000 | |
| Previous Owner | Parkerson Donald R | $93,781 |
Source: Public Records
Tax History Compared to Growth
Tax History
| Year | Tax Paid | Tax Assessment Tax Assessment Total Assessment is a certain percentage of the fair market value that is determined by local assessors to be the total taxable value of land and additions on the property. | Land | Improvement |
|---|---|---|---|---|
| 2025 | $4,039 | $301,754 | $90,526 | $211,228 |
| 2024 | $4,039 | $295,837 | $88,751 | $207,086 |
| 2023 | $3,949 | $290,036 | $87,011 | $203,025 |
| 2022 | $3,950 | $284,349 | $85,305 | $199,044 |
| 2021 | $3,916 | $278,773 | $83,632 | $195,141 |
| 2020 | $3,913 | $275,914 | $82,774 | $193,140 |
| 2019 | $3,783 | $270,504 | $81,151 | $189,353 |
| 2018 | $3,673 | $265,200 | $79,560 | $185,640 |
| 2017 | $2,869 | $218,500 | $65,900 | $152,600 |
| 2016 | $2,656 | $204,200 | $61,600 | $142,600 |
| 2015 | $2,545 | $189,000 | $57,000 | $132,000 |
| 2014 | $2,236 | $167,000 | $50,000 | $117,000 |
Source: Public Records
Map
Nearby Homes
- 7717 Church Ave Unit 166
- 7717 Church Ave Unit 142
- 7717 Church Ave Unit 160
- 7717 Church Ave Unit 54
- 7717 Church Ave Unit 77
- 7717 Church Ave Unit 214
- 7717 Church Ave Unit 95
- 27856 Fieldstone Dr
- 7511 Buckeye St
- 2246 Springmeadow Ct
- 2255 Springmeadow Ct
- 7440 Apple Blossom Ct
- 27328 Norwood St
- 7001 Church Ave Unit 5
- 6941 La Praix St
- 28037 Clifton St
- 6986 Church Ave
- 27256 13th St
- 0 Baseline St Unit CV25136921
- 27471 Main St
- 7435 Seine Ave
- 7457 Seine Ave
- 7442 Catalpa Ave
- 7452 Catalpa Ave
- 7432 Catalpa Ave
- 7465 Seine Ave
- 7423 Seine Ave
- 7444 Seine Ave
- 7456 Seine Ave
- 7422 Catalpa Ave
- 7462 Catalpa Ave
- 7432 Seine Ave
- 7466 Seine Ave
- 7479 Seine Ave
- 7413 Seine Ave
- 7420 Seine Ave
- 7412 Catalpa Ave
- 7472 Catalpa Ave
- 7443 Catalpa Ave
- 7476 Seine Ave