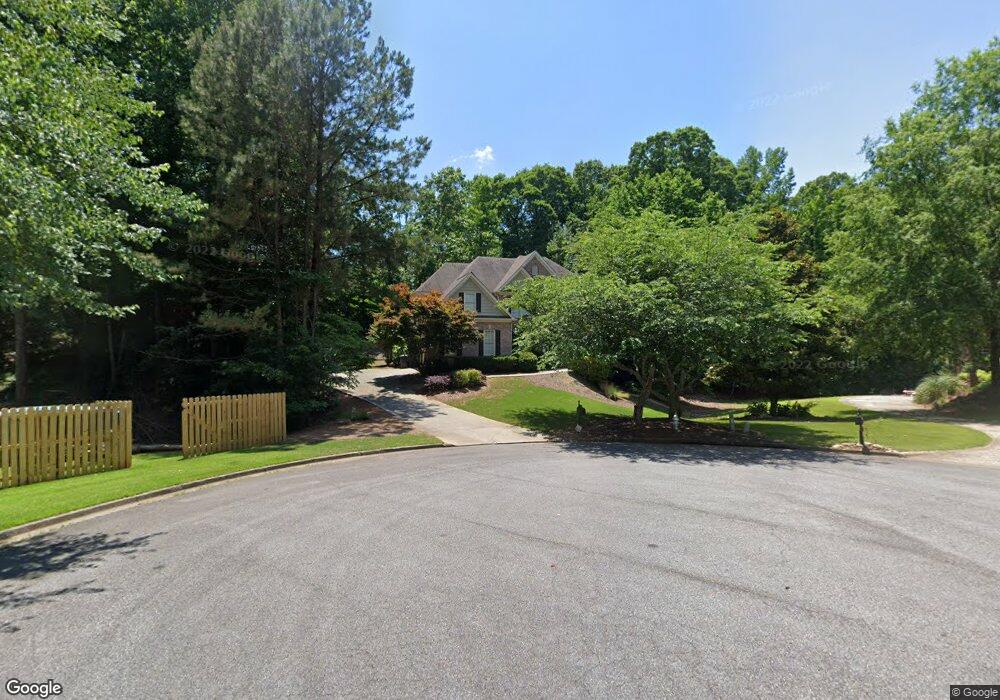
7445 Regent Ct Cumming, GA 30040
Estimated Value: $680,341 - $792,000
4
Beds
4
Baths
2,854
Sq Ft
$260/Sq Ft
Est. Value
About This Home
This home is located at 7445 Regent Ct, Cumming, GA 30040 and is currently estimated at $741,335, approximately $259 per square foot. 7445 Regent Ct is a home located in Forsyth County with nearby schools including Vickery Creek Middle School, West Forsyth High School, and Covenant Christian Academy.
Ownership History
Date
Name
Owned For
Owner Type
Purchase Details
Closed on
May 10, 2023
Sold by
Rojas Julio C
Bought by
R & R Family Trust
Current Estimated Value
Purchase Details
Closed on
Oct 23, 2001
Sold by
Rojas Julio S
Bought by
Rojas Julio S and Rojas Patricia R
Home Financials for this Owner
Home Financials are based on the most recent Mortgage that was taken out on this home.
Original Mortgage
$185,000
Interest Rate
6.5%
Mortgage Type
New Conventional
Purchase Details
Closed on
Sep 21, 1999
Sold by
J O C Prop Inc
Bought by
Tains Russell W and Tains Lorie Y
Home Financials for this Owner
Home Financials are based on the most recent Mortgage that was taken out on this home.
Original Mortgage
$202,750
Interest Rate
8.22%
Mortgage Type
New Conventional
Purchase Details
Closed on
May 21, 1999
Sold by
Embry Timothy J
Bought by
Joc Prop Inc
Create a Home Valuation Report for This Property
The Home Valuation Report is an in-depth analysis detailing your home's value as well as a comparison with similar homes in the area
Home Values in the Area
Average Home Value in this Area
Purchase History
| Date | Buyer | Sale Price | Title Company |
|---|---|---|---|
| R & R Family Trust | -- | None Listed On Document | |
| Rojas Julio S | -- | -- | |
| Rojas Julio C | $287,300 | -- | |
| Tains Russell W | $253,500 | -- | |
| Joc Prop Inc | $30,000 | -- |
Source: Public Records
Mortgage History
| Date | Status | Borrower | Loan Amount |
|---|---|---|---|
| Previous Owner | Rojas Julio C | $185,000 | |
| Previous Owner | Tains Russell W | $202,750 |
Source: Public Records
Tax History Compared to Growth
Tax History
| Year | Tax Paid | Tax Assessment Tax Assessment Total Assessment is a certain percentage of the fair market value that is determined by local assessors to be the total taxable value of land and additions on the property. | Land | Improvement |
|---|---|---|---|---|
| 2025 | $5,146 | $267,264 | $64,000 | $203,264 |
| 2024 | $5,146 | $265,180 | $60,000 | $205,180 |
| 2023 | $4,130 | $225,568 | $60,000 | $165,568 |
| 2022 | $4,449 | $154,336 | $40,000 | $114,336 |
| 2021 | $3,733 | $154,336 | $40,000 | $114,336 |
| 2020 | $3,671 | $151,320 | $30,000 | $121,320 |
| 2019 | $3,542 | $144,820 | $30,000 | $114,820 |
| 2018 | $3,518 | $142,644 | $30,000 | $112,644 |
| 2017 | $3,263 | $129,920 | $30,000 | $99,920 |
| 2016 | $3,137 | $123,920 | $24,000 | $99,920 |
| 2015 | $3,143 | $123,920 | $24,000 | $99,920 |
| 2014 | $2,765 | $113,384 | $22,000 | $91,384 |
Source: Public Records
Map
Nearby Homes
- 7105 Weybridge Dr
- 7020 Weybridge Dr
- 6610 Major Dr
- 6302 Valley Stream Dr
- Promenade Plan at The Courtyards by The Manor
- Portico Plan at The Courtyards by The Manor
- Palazzo Plan at The Courtyards by The Manor
- Provenance Plan at The Courtyards by The Manor
- 3755 Gardenside Ct
- 3590 Manor Court Dr
- 3580 Manor Court Dr
- 6935 Black Fox Ln
- 6930 Black Fox Ln
- 6920 Black Fox Ln
- 6320 Westerly Way
- 3245 Longstreet Rd
- 6705 Fox Creek Dr
- Hedgewood Plan at Bridlefield - Highlands Collection
- Donington with Basement Plan at Bridlefield - Manor Collection
- Parkstone Plan at Northfield
- 7450 Regent Ct
- 6410 Red Oak Ct
- 6420 Red Oak Ct
- 7440 Regent Ct
- 7425 Regent Ct
- 6430 Black Oak Dr
- 7265 Gresham Trace
- 7430 Regent Ct
- 7415 Regent Ct
- 7255 Gresham Trace
- 6415 Red Oak Ct
- 7245 Gresham Trace
- 7225 Gresham Trace
- 7420 Regent Ct
- 6420 Black Oak Dr
- 7275 Gresham Trace
- 7405 Regent Ct
- 7430 Compton Cir
- 7320 Compton Cir
- 7210 Compton Cir