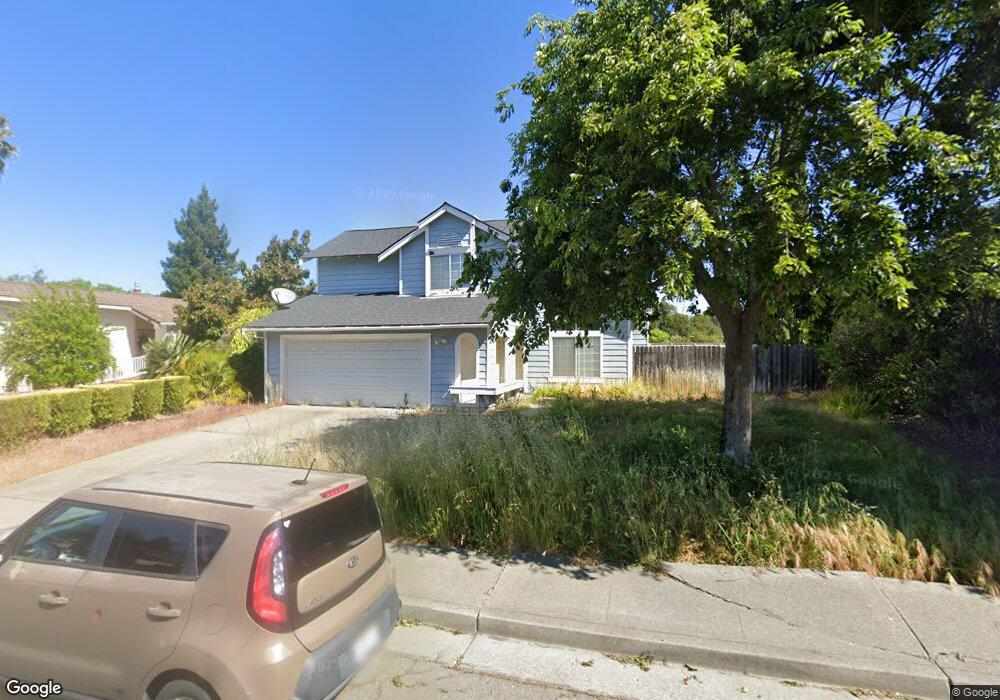
745 Capricorn Cir Fairfield, CA 94533
Estimated Value: $473,000 - $544,000
3
Beds
3
Baths
1,637
Sq Ft
$315/Sq Ft
Est. Value
About This Home
This home is located at 745 Capricorn Cir, Fairfield, CA 94533 and is currently estimated at $515,919, approximately $315 per square foot. 745 Capricorn Cir is a home located in Solano County with nearby schools including Grange Middle School, Fairfield High School, and Fairfield Christian School.
Ownership History
Date
Name
Owned For
Owner Type
Purchase Details
Closed on
Dec 9, 2024
Sold by
Michael Leung And Helen W Leung Trust and Leung Michael Lit
Bought by
Michael Leung And Helen W Leung Trust and Leung
Current Estimated Value
Purchase Details
Closed on
Dec 4, 2019
Sold by
Wong Paul and Wong Carol
Bought by
Leung Michael and Leung Helen W
Purchase Details
Closed on
Jan 31, 2001
Sold by
Hancock William S
Bought by
Hancock Agnes W D
Purchase Details
Closed on
Jan 25, 2001
Sold by
Hancock Agnes W D
Bought by
Wong Margaret
Purchase Details
Closed on
Jan 24, 2001
Sold by
Diricco Robert J and Hancock Agnes W D
Bought by
Diricco Robert J and Hancock Agnes W D
Purchase Details
Closed on
Mar 24, 1995
Sold by
Paul Wong
Bought by
Wong Paul and Wong Carol
Purchase Details
Closed on
Mar 22, 1994
Sold by
Wong Paul and Wong Carol
Bought by
Wong Paul and Wong Carol
Home Financials for this Owner
Home Financials are based on the most recent Mortgage that was taken out on this home.
Original Mortgage
$76,000
Interest Rate
7.38%
Create a Home Valuation Report for This Property
The Home Valuation Report is an in-depth analysis detailing your home's value as well as a comparison with similar homes in the area
Home Values in the Area
Average Home Value in this Area
Purchase History
| Date | Buyer | Sale Price | Title Company |
|---|---|---|---|
| Michael Leung And Helen W Leung Trust | -- | None Listed On Document | |
| Leung Michael | $331,000 | Fidelity National Title Co | |
| Hancock Agnes W D | -- | -- | |
| Wong Margaret | $3,000 | -- | |
| Diricco Robert J | -- | -- | |
| Wong Paul | $58,500 | -- | |
| Wong Paul | $71,500 | First American Title |
Source: Public Records
Mortgage History
| Date | Status | Borrower | Loan Amount |
|---|---|---|---|
| Previous Owner | Wong Paul | $76,000 |
Source: Public Records
Tax History Compared to Growth
Tax History
| Year | Tax Paid | Tax Assessment Tax Assessment Total Assessment is a certain percentage of the fair market value that is determined by local assessors to be the total taxable value of land and additions on the property. | Land | Improvement |
|---|---|---|---|---|
| 2025 | $4,474 | $400,074 | $115,810 | $284,264 |
| 2024 | $4,474 | $392,231 | $113,540 | $278,691 |
| 2023 | $4,337 | $384,541 | $111,314 | $273,227 |
| 2022 | $4,284 | $377,002 | $109,132 | $267,870 |
| 2021 | $4,242 | $369,611 | $106,993 | $262,618 |
| 2020 | $4,143 | $365,822 | $105,896 | $259,926 |
| 2019 | $2,423 | $213,899 | $61,868 | $152,031 |
| 2018 | $2,501 | $209,705 | $60,655 | $149,050 |
| 2017 | $2,386 | $205,594 | $59,466 | $146,128 |
| 2016 | $2,363 | $201,563 | $58,300 | $143,263 |
| 2015 | $2,207 | $198,537 | $57,425 | $141,112 |
| 2014 | $2,187 | $194,649 | $56,301 | $138,348 |
Source: Public Records
Map
Nearby Homes
- 730 Capricorn Cir
- 2564 Sunrise Dr
- 2571 Sunrise Dr
- Arlo Plan at Villages at Fairfield - Summerwalk at the Villages
- Bennett Plan at Villages at Fairfield - Summerwalk at the Villages
- Carson Plan at Villages at Fairfield - Summerwalk at the Villages
- Darby Plan at Villages at Fairfield - Summerwalk at the Villages
- 2429 Baltic Dr
- 722 Rosemary Ct
- 2924 Redwood Dr
- 1032 Wood Hollow Cir
- 424 Chelsea Way
- 727 Shamrock Ct
- 1031 Valley Oak Way
- 558 Maywood Way
- 2275 Dover Ave
- 1039 Valley Oak Way
- 2827 Sunburst Dr
- 3015 Redwood Dr
- 3087 Pecan Cir
- 747 Capricorn Cir
- 743 Capricorn Cir
- 749 Capricorn Cir
- 741 Capricorn Cir
- 746 Capricorn Cir
- 748 Capricorn Cir
- 750 Capricorn Cir
- 739 Capricorn Cir
- 755 Normandy Ct
- 732 Capricorn Cir
- 737 Capricorn Cir
- 753 Capricorn Cir
- 735 Capricorn Cir
- 2512 Talisman Ct
- 752 Capricorn Cir
- 2518 Talisman Ct
- 754 Normandy Ct
- 733 Capricorn Cir