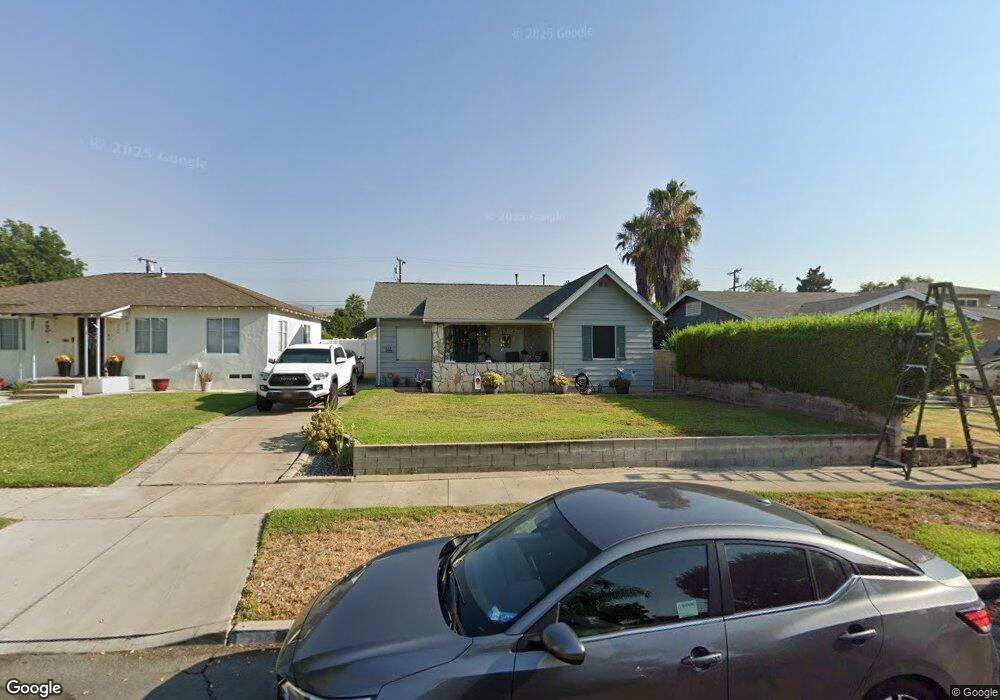
745 E F St Ontario, CA 91764
Downtown Ontario NeighborhoodEstimated Value: $512,000 - $673,000
3
Beds
2
Baths
932
Sq Ft
$634/Sq Ft
Est. Value
About This Home
This home is located at 745 E F St, Ontario, CA 91764 and is currently estimated at $590,597, approximately $633 per square foot. 745 E F St is a home located in San Bernardino County with nearby schools including Berlyn Elementary, Vina Danks Middle, and Chaffey High School.
Ownership History
Date
Name
Owned For
Owner Type
Purchase Details
Closed on
Oct 8, 2025
Sold by
Savage Family Living Trust and Savage Mary Sue
Bought by
Savage Rentals Llc
Current Estimated Value
Purchase Details
Closed on
Jul 11, 2008
Sold by
Us Bank Na
Bought by
Savage James and Savage Mary Sue
Purchase Details
Closed on
May 1, 2008
Sold by
Rivera Joe
Bought by
Us Bank Na and Asset Backed Pass Through Certificates S
Purchase Details
Closed on
Sep 28, 2006
Sold by
Smith Geoffrey L
Bought by
Rivera Joe and Rivera Olivia
Home Financials for this Owner
Home Financials are based on the most recent Mortgage that was taken out on this home.
Original Mortgage
$316,000
Interest Rate
6.55%
Mortgage Type
Purchase Money Mortgage
Create a Home Valuation Report for This Property
The Home Valuation Report is an in-depth analysis detailing your home's value as well as a comparison with similar homes in the area
Home Values in the Area
Average Home Value in this Area
Purchase History
We collect this data history from publicly available records. To have your information removed, we recommend requesting removal directly through your county’s website.
| Date | Buyer | Sale Price | Title Company |
|---|---|---|---|
| Savage Rentals Llc | -- | None Listed On Document | |
| Savage James | $225,000 | Fidelity National Title Co | |
| Us Bank Na | $227,850 | None Available | |
| Rivera Joe | $395,000 | First American Title Company |
Source: Public Records
Mortgage History
We collect this data history from publicly available records. To have your information removed, we recommend requesting removal directly through your county’s website.
| Date | Status | Borrower | Loan Amount |
|---|---|---|---|
| Previous Owner | Rivera Joe | $316,000 |
Source: Public Records
Tax History
| Year | Tax Paid | Tax Assessment Tax Assessment Total Assessment is a certain percentage of the fair market value that is determined by local assessors to be the total taxable value of land and additions on the property. | Land | Improvement |
|---|---|---|---|---|
| 2025 | $3,195 | $289,746 | $103,022 | $186,724 |
| 2024 | $3,123 | $284,065 | $101,002 | $183,063 |
| 2023 | $3,035 | $278,496 | $99,022 | $179,474 |
| 2022 | $2,995 | $273,035 | $97,080 | $175,955 |
| 2021 | $2,977 | $267,681 | $95,176 | $172,505 |
| 2020 | $2,924 | $264,936 | $94,200 | $170,736 |
| 2019 | $2,899 | $259,741 | $92,353 | $167,388 |
| 2018 | $2,859 | $254,648 | $90,542 | $164,106 |
| 2017 | $2,757 | $249,655 | $88,767 | $160,888 |
| 2016 | $2,648 | $244,759 | $87,026 | $157,733 |
| 2015 | $2,630 | $241,083 | $85,719 | $155,364 |
| 2014 | $2,549 | $236,361 | $84,040 | $152,321 |
Source: Public Records
Map
Nearby Homes
Your Personal Tour Guide
Ask me questions while you tour the home.