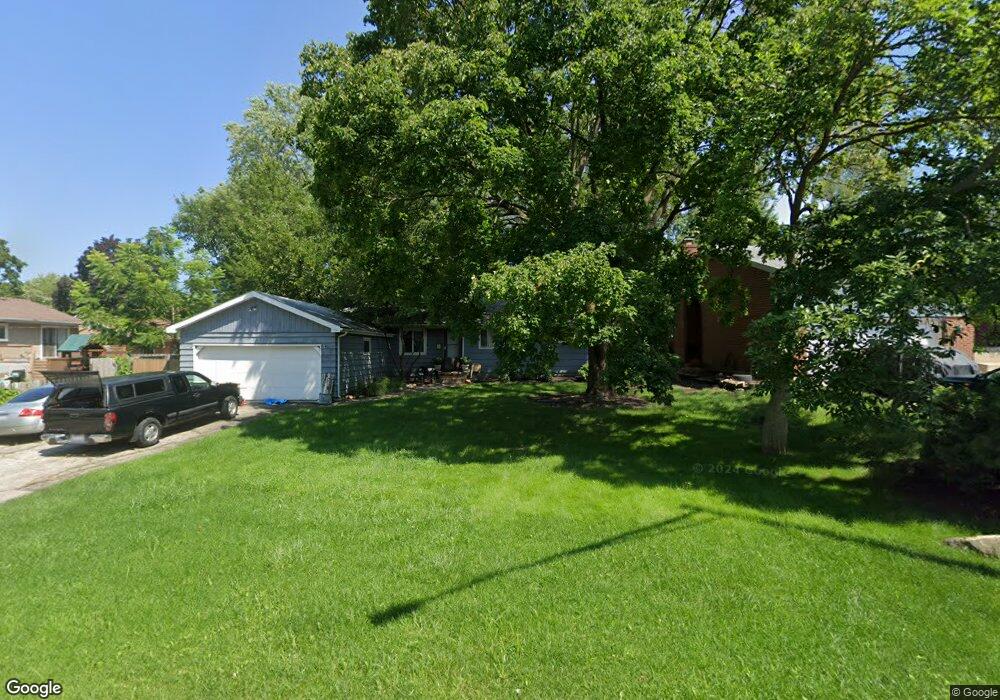
745 Firth Rd Mundelein, IL 60060
Loch Lomond NeighborhoodEstimated Value: $301,000 - $324,000
3
Beds
1
Bath
1,344
Sq Ft
$230/Sq Ft
Est. Value
About This Home
This home is located at 745 Firth Rd, Mundelein, IL 60060 and is currently estimated at $309,514, approximately $230 per square foot. 745 Firth Rd is a home located in Lake County with nearby schools including Mechanics Grove Elementary School, Washington Early Learning Center, and Carl Sandburg Middle School.
Ownership History
Date
Name
Owned For
Owner Type
Purchase Details
Closed on
Jul 31, 2001
Sold by
Ahlgrim Ronald C and Ahlgrim Kristy A
Bought by
Halvorsen Alex M
Current Estimated Value
Home Financials for this Owner
Home Financials are based on the most recent Mortgage that was taken out on this home.
Original Mortgage
$124,000
Outstanding Balance
$48,231
Interest Rate
7.11%
Estimated Equity
$261,283
Purchase Details
Closed on
Jul 23, 1998
Sold by
Ahlgrim Ronald C
Bought by
Ahlgrim Ronald C and Ahlgrim Kristy A
Purchase Details
Closed on
Jan 5, 1998
Sold by
Albiero David M and Albiero Bonnie L
Bought by
Ahlgrim Ronald C
Home Financials for this Owner
Home Financials are based on the most recent Mortgage that was taken out on this home.
Original Mortgage
$110,800
Interest Rate
7.26%
Mortgage Type
Balloon
Purchase Details
Closed on
Jan 17, 1995
Sold by
Hunt Tim R and Hunt Lana R
Bought by
Albiero David M and Albiero Bonnie L
Home Financials for this Owner
Home Financials are based on the most recent Mortgage that was taken out on this home.
Original Mortgage
$101,700
Interest Rate
9.2%
Create a Home Valuation Report for This Property
The Home Valuation Report is an in-depth analysis detailing your home's value as well as a comparison with similar homes in the area
Home Values in the Area
Average Home Value in this Area
Purchase History
| Date | Buyer | Sale Price | Title Company |
|---|---|---|---|
| Halvorsen Alex M | $155,000 | -- | |
| Ahlgrim Ronald C | -- | -- | |
| Ahlgrim Ronald C | $138,500 | -- | |
| Albiero David M | $114,000 | -- |
Source: Public Records
Mortgage History
| Date | Status | Borrower | Loan Amount |
|---|---|---|---|
| Open | Halvorsen Alex M | $124,000 | |
| Previous Owner | Ahlgrim Ronald C | $110,800 | |
| Previous Owner | Albiero David M | $101,700 | |
| Closed | Halvorsen Alex M | $15,500 |
Source: Public Records
Tax History Compared to Growth
Tax History
| Year | Tax Paid | Tax Assessment Tax Assessment Total Assessment is a certain percentage of the fair market value that is determined by local assessors to be the total taxable value of land and additions on the property. | Land | Improvement |
|---|---|---|---|---|
| 2024 | $6,352 | $74,005 | $18,432 | $55,573 |
| 2023 | $6,352 | $67,807 | $16,888 | $50,919 |
| 2022 | $6,102 | $62,726 | $20,342 | $42,384 |
| 2021 | $5,615 | $58,530 | $19,638 | $38,892 |
| 2020 | $5,517 | $56,920 | $19,098 | $37,822 |
| 2019 | $5,335 | $55,048 | $18,470 | $36,578 |
| 2018 | $5,336 | $55,086 | $17,703 | $37,383 |
| 2017 | $5,264 | $53,352 | $17,146 | $36,206 |
| 2016 | $5,114 | $50,672 | $16,285 | $34,387 |
| 2015 | $4,969 | $47,504 | $15,267 | $32,237 |
| 2014 | $4,983 | $48,361 | $15,273 | $33,088 |
| 2012 | $4,961 | $48,791 | $15,409 | $33,382 |
Source: Public Records
Map
Nearby Homes
- 728 W Maple Ave
- 654 Blue Spruce Ln
- 851 Glenview Ave
- 547 N Ridgemoor Ave
- 973 Highland Rd
- 522 W Park St
- 212 Londonderry Ct
- 1152 Aberdeen Ln
- 1021 Wrens Gate
- 742 N Lake St
- 25 Wellington Ave
- 1285 Appleby Cir
- 1304 Dunleer Dr
- 191 Springbrook Ct
- 70 N Ridgemoor Ave
- 116 N Prairie Ave
- 1291 Banbury Rd
- 1313 Turnberry Ln
- 29746 U S 45
- 1349 Spalding Dr