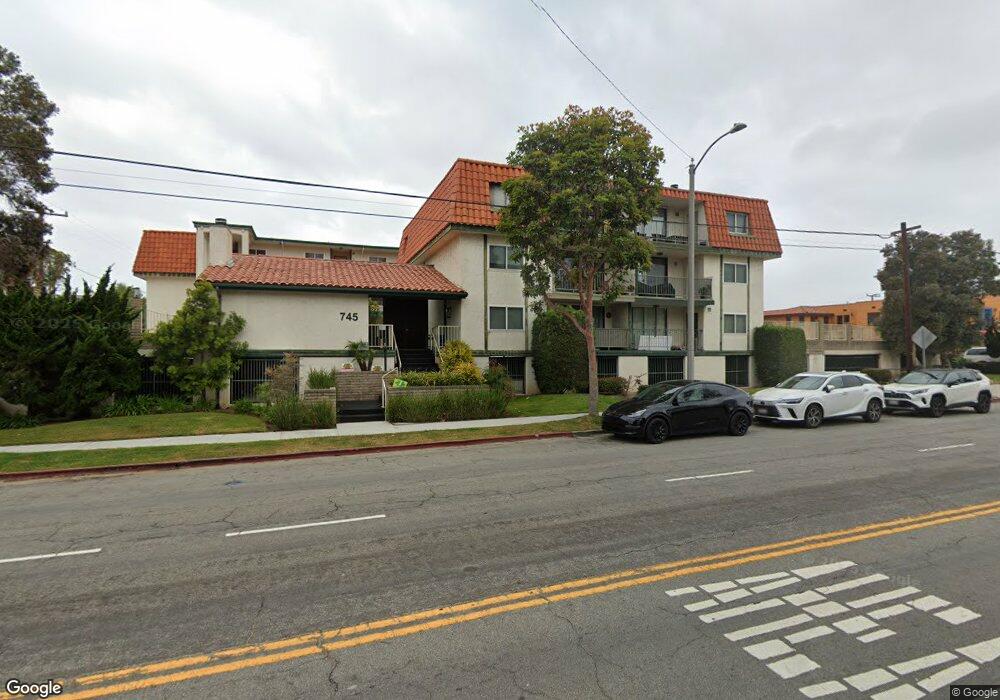
745 Main St Unit 208 El Segundo, CA 90245
Estimated Value: $769,935 - $949,000
2
Beds
2
Baths
1,173
Sq Ft
$734/Sq Ft
Est. Value
About This Home
This home is located at 745 Main St Unit 208, El Segundo, CA 90245 and is currently estimated at $860,984, approximately $734 per square foot. 745 Main St Unit 208 is a home located in Los Angeles County with nearby schools including Richmond Street Elementary School, El Segundo Middle School, and El Segundo High School.
Ownership History
Date
Name
Owned For
Owner Type
Purchase Details
Closed on
Jul 18, 2000
Sold by
Zweifel Orva
Bought by
Renton Karen
Current Estimated Value
Home Financials for this Owner
Home Financials are based on the most recent Mortgage that was taken out on this home.
Original Mortgage
$140,000
Outstanding Balance
$49,461
Interest Rate
8.25%
Estimated Equity
$811,523
Purchase Details
Closed on
Sep 24, 1997
Sold by
Miller Dorothy O
Bought by
Wahrman Paul B
Home Financials for this Owner
Home Financials are based on the most recent Mortgage that was taken out on this home.
Original Mortgage
$150,100
Interest Rate
6.5%
Create a Home Valuation Report for This Property
The Home Valuation Report is an in-depth analysis detailing your home's value as well as a comparison with similar homes in the area
Home Values in the Area
Average Home Value in this Area
Purchase History
| Date | Buyer | Sale Price | Title Company |
|---|---|---|---|
| Renton Karen | $205,000 | Lawyers Title Company | |
| Wahrman Paul B | $158,000 | Benefit Land Title Company |
Source: Public Records
Mortgage History
| Date | Status | Borrower | Loan Amount |
|---|---|---|---|
| Open | Renton Karen | $140,000 | |
| Previous Owner | Wahrman Paul B | $150,100 |
Source: Public Records
Tax History
| Year | Tax Paid | Tax Assessment Tax Assessment Total Assessment is a certain percentage of the fair market value that is determined by local assessors to be the total taxable value of land and additions on the property. | Land | Improvement |
|---|---|---|---|---|
| 2025 | $3,419 | $308,882 | $128,073 | $180,809 |
| 2024 | $3,419 | $302,826 | $125,562 | $177,264 |
| 2023 | $3,332 | $296,889 | $123,100 | $173,789 |
| 2022 | $3,366 | $291,069 | $120,687 | $170,382 |
| 2021 | $3,314 | $285,363 | $118,321 | $167,042 |
| 2020 | $3,251 | $282,438 | $117,108 | $165,330 |
| 2019 | $3,200 | $276,901 | $114,812 | $162,089 |
| 2018 | $3,002 | $271,472 | $112,561 | $158,911 |
| 2016 | $2,905 | $260,933 | $108,191 | $152,742 |
| 2015 | $2,868 | $257,014 | $106,566 | $150,448 |
| 2014 | $2,814 | $251,980 | $104,479 | $147,501 |
Source: Public Records
Map
Nearby Homes
- 745 Main St
- 121 E Walnut Ave
- 329 E Maple Ave
- 924 Main St
- 935 Main St Unit 202
- 935 Main St Unit 303
- 505 W Maple Ave
- 219 W Acacia Ave
- 212 E Imperial Ave Unit E
- 724 Loma Vista St
- 955 Virginia St
- 426 E Imperial Ave
- 516 Penn St
- 627 W Pine Ave
- 572 E Imperial Ave
- 408 Loma Vista St
- 804 Hillcrest St
- 574 E Imperial Ave
- 608 Lomita St
- 716 W Oak Ave
- 745 Main St Unit 204
- 745 Main St Unit 203
- 745 Main St Unit 201
- 745 Main St Unit 108
- 745 Main St Unit 107
- 745 Main St Unit 106
- 745 Main St Unit 105
- 745 Main St Unit 104
- 745 Main St Unit 103
- 745 Main St Unit 102
- 745 Main St Unit 101
- 745 Main St Unit 308
- 745 Main St Unit 307
- 745 Main St Unit 306
- 745 Main St Unit 305
- 745 Main St Unit 304
- 745 Main St Unit 303
- 745 Main St Unit 302
- 745 Main St Unit 301
- 745 Main St Unit 207