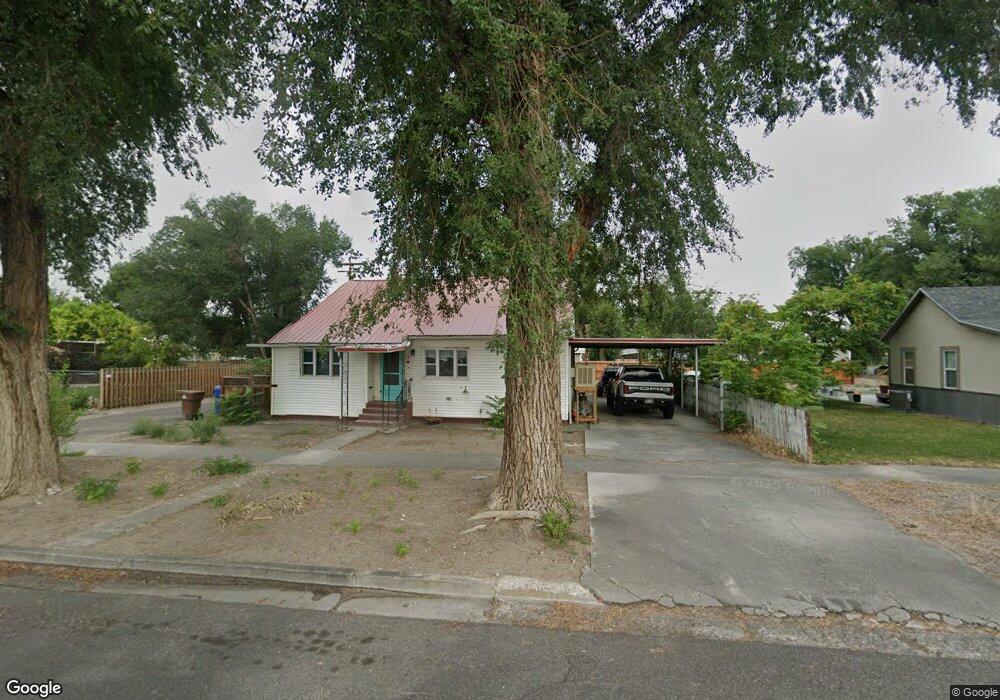
745 N 5th St Montrose, CO 81401
Estimated Value: $216,000 - $357,000
2
Beds
1
Bath
1,320
Sq Ft
$200/Sq Ft
Est. Value
About This Home
This home is located at 745 N 5th St, Montrose, CO 81401 and is currently estimated at $264,003, approximately $200 per square foot. 745 N 5th St is a home located in Montrose County with nearby schools including Northside Elementary School, Centennial Middle School, and Montrose High School.
Ownership History
Date
Name
Owned For
Owner Type
Purchase Details
Closed on
Aug 12, 2024
Sold by
Moreland Albert F
Bought by
Frasier Curt
Current Estimated Value
Home Financials for this Owner
Home Financials are based on the most recent Mortgage that was taken out on this home.
Original Mortgage
$176,757
Interest Rate
6%
Mortgage Type
Construction
Purchase Details
Closed on
Mar 2, 2022
Sold by
Ridgeline Homes Llc
Bought by
Rio Grande 4 Llc
Purchase Details
Closed on
Jan 14, 2005
Sold by
Moreland Albert F
Bought by
Moreland Albert F
Purchase Details
Closed on
Jul 17, 1984
Sold by
Duke Kathaleen F and Duke Leroy A
Bought by
Moreland Albert F and Moreland Anna Mary
Purchase Details
Closed on
Aug 10, 1977
Sold by
Bishop Janet M and Bishop George P
Bought by
Duke Kathaleen F and Duke Leroy A
Create a Home Valuation Report for This Property
The Home Valuation Report is an in-depth analysis detailing your home's value as well as a comparison with similar homes in the area
Home Values in the Area
Average Home Value in this Area
Purchase History
| Date | Buyer | Sale Price | Title Company |
|---|---|---|---|
| Frasier Curt | $177,057 | Land Title Guarantee | |
| Rio Grande 4 Llc | -- | None Listed On Document | |
| La Salle 2 Llc | -- | None Listed On Document | |
| Moreland Albert F | -- | None Available | |
| Moreland Albert F | $14,500 | -- | |
| Duke Kathaleen F | $12,000 | -- |
Source: Public Records
Mortgage History
| Date | Status | Borrower | Loan Amount |
|---|---|---|---|
| Closed | Frasier Curt | $176,757 |
Source: Public Records
Tax History Compared to Growth
Tax History
| Year | Tax Paid | Tax Assessment Tax Assessment Total Assessment is a certain percentage of the fair market value that is determined by local assessors to be the total taxable value of land and additions on the property. | Land | Improvement |
|---|---|---|---|---|
| 2024 | $1,017 | $14,290 | $2,930 | $11,360 |
| 2023 | $1,017 | $18,640 | $3,820 | $14,820 |
| 2022 | $928 | $13,490 | $2,780 | $10,710 |
| 2021 | $580 | $8,410 | $2,860 | $5,550 |
| 2020 | $490 | $7,310 | $2,470 | $4,840 |
| 2019 | $814 | $12,060 | $2,470 | $9,590 |
| 2018 | $633 | $9,150 | $1,990 | $7,160 |
| 2017 | $628 | $9,150 | $1,990 | $7,160 |
| 2016 | $585 | $8,660 | $2,010 | $6,650 |
| 2015 | $574 | $8,660 | $2,010 | $6,650 |
| 2014 | $453 | $7,300 | $2,010 | $5,290 |
Source: Public Records
Map
Nearby Homes
- 701 N 4th St
- 700 N Nevada Ave
- 512 N 5th St
- 806 N Park Ave
- 638 N Cascade Ave
- 1037 N 1st St
- 218 N Stough Ave
- 338 N Stough Ave
- 1201 N San Juan Ave
- TBD N Cedar
- 147 E Main St Unit 147 Main , 18 N Se
- Lot 131 Haynes Drives
- 945 N Selig Ave
- TBD S 4th St
- 841 N Grand Ave
- 612 & 616 S 6th
- 505 Miami Rd
- 901 6530 Rd Unit 3007
- 901 6530 Rd Unit 3211
- 901 6530 Rd Unit 1504
- 747 N 5th St
- 519 N Nevada Ave
- 521 N Nevada Ave
- 520 N Mesa Ave
- 524 N Mesa Ave
- 532 N Mesa Ave
- 539 N Nevada Ave
- 718 N 5th St
- 738 N 5th St
- 724 N 6th St
- 447 N Nevada Ave
- 712 N 5th St
- 540 N Mesa Ave
- 805 N 5th St
- 700 N 5th St
- 520 N Nevada Ave
- 540 N Nevada Ave
- 800 N 5th St
- 821 N 5th St
- N Nevada (2 Houses) Ave Unit 729 N. 6th St