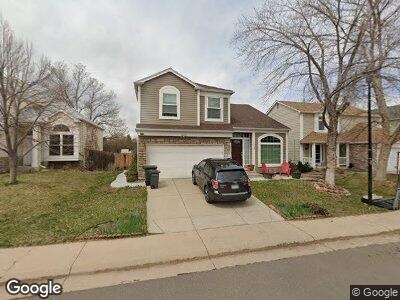
745 Parthenon Ct Lafayette, CO 80026
Estimated Value: $700,000 - $747,000
4
Beds
4
Baths
1,594
Sq Ft
$452/Sq Ft
Est. Value
About This Home
This home is located at 745 Parthenon Ct, Lafayette, CO 80026 and is currently estimated at $720,956, approximately $452 per square foot. 745 Parthenon Ct is a home located in Boulder County with nearby schools including Lafayette Elementary School, Angevine Middle School, and Centaurus High School.
Ownership History
Date
Name
Owned For
Owner Type
Purchase Details
Closed on
Jun 5, 2006
Sold by
Pelsmaeker Alwin J and Pelsmaeker Maureen A
Bought by
Pelsmaeker Maureen A
Current Estimated Value
Purchase Details
Closed on
Nov 21, 1997
Sold by
Bauer Mark A
Bought by
Pelsmaeker Alwin J
Home Financials for this Owner
Home Financials are based on the most recent Mortgage that was taken out on this home.
Original Mortgage
$147,600
Interest Rate
7.23%
Purchase Details
Closed on
Dec 18, 1995
Sold by
Gavit Donald E
Bought by
Bauer Mark A
Home Financials for this Owner
Home Financials are based on the most recent Mortgage that was taken out on this home.
Original Mortgage
$112,000
Interest Rate
7.4%
Purchase Details
Closed on
Aug 10, 1992
Bought by
Pelsmaeker Maureen A
Purchase Details
Closed on
Jan 28, 1992
Bought by
Pelsmaeker Maureen A
Create a Home Valuation Report for This Property
The Home Valuation Report is an in-depth analysis detailing your home's value as well as a comparison with similar homes in the area
Home Values in the Area
Average Home Value in this Area
Purchase History
| Date | Buyer | Sale Price | Title Company |
|---|---|---|---|
| Pelsmaeker Maureen A | -- | None Available | |
| Pelsmaeker Alwin J | $164,000 | -- | |
| Bauer Mark A | $146,000 | -- | |
| Pelsmaeker Maureen A | $112,000 | -- | |
| Pelsmaeker Maureen A | $99,500 | -- |
Source: Public Records
Mortgage History
| Date | Status | Borrower | Loan Amount |
|---|---|---|---|
| Open | Pelsmaeker Maureen A | $114,000 | |
| Closed | Pelsmaeker Maureen A | $127,000 | |
| Closed | Pelsmaeker Alwin J | $140,412 | |
| Closed | Pelsmaeker Alwin J | $141,000 | |
| Closed | Pelsmaeker Alwin J | $147,600 | |
| Previous Owner | Bauer Mark A | $112,000 |
Source: Public Records
Tax History Compared to Growth
Tax History
| Year | Tax Paid | Tax Assessment Tax Assessment Total Assessment is a certain percentage of the fair market value that is determined by local assessors to be the total taxable value of land and additions on the property. | Land | Improvement |
|---|---|---|---|---|
| 2024 | $3,761 | $43,188 | $10,994 | $32,194 |
| 2023 | $3,761 | $43,188 | $14,680 | $32,194 |
| 2022 | $3,178 | $33,833 | $11,419 | $22,414 |
| 2021 | $3,143 | $34,806 | $11,747 | $23,059 |
| 2020 | $2,964 | $32,433 | $9,367 | $23,066 |
| 2019 | $2,923 | $32,433 | $9,367 | $23,066 |
| 2018 | $2,686 | $29,426 | $9,000 | $20,426 |
| 2017 | $2,616 | $32,533 | $9,950 | $22,583 |
| 2016 | $2,326 | $25,337 | $7,244 | $18,093 |
| 2015 | $2,180 | $21,071 | $5,652 | $15,419 |
| 2014 | $1,822 | $21,071 | $5,652 | $15,419 |
Source: Public Records
Map
Nearby Homes
- 880 Orion Dr
- 901 Delphi Dr
- 1035 Milo Cir Unit B
- 717 S Carr Ave
- 1032 Pegasus Place
- 1055 Milo Cir Unit A
- 910 Sparta Dr
- 718 Julian Cir
- 1250 Acropolis Dr
- 1198 Milo Cir Unit A
- 612 S Bermont Ave
- 714 S Longmont Ave
- 180 Mercator Ave
- 505 S Roosevelt Ave
- 1202 Warrior Way Unit A1202
- 1105 Bacchus Dr Unit 8
- 1100 Bacchus Dr Unit A
- 1902 Pioneer Cir
- 1715 Pioneer Cir
- 101 W Cannon St