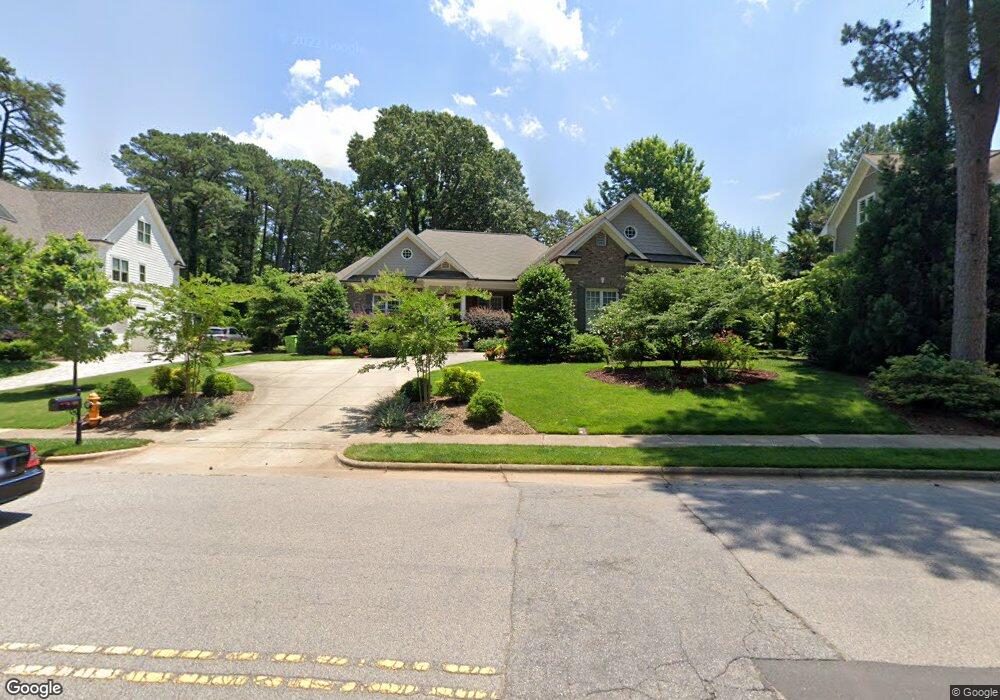
745 Powell Dr Raleigh, NC 27606
Avent West NeighborhoodEstimated Value: $871,000 - $1,048,000
5
Beds
5
Baths
3,352
Sq Ft
$286/Sq Ft
Est. Value
About This Home
This home is located at 745 Powell Dr, Raleigh, NC 27606 and is currently estimated at $959,680, approximately $286 per square foot. 745 Powell Dr is a home located in Wake County with nearby schools including Adams Elementary, Lufkin Road Middle School, and Atlas International School.
Ownership History
Date
Name
Owned For
Owner Type
Purchase Details
Closed on
May 25, 2017
Sold by
Barker William Bryant and Barker Jacyn Boyd
Bought by
Martin William Arthur and Martin Lisa Dell
Current Estimated Value
Home Financials for this Owner
Home Financials are based on the most recent Mortgage that was taken out on this home.
Original Mortgage
$300,000
Outstanding Balance
$249,350
Interest Rate
4.08%
Mortgage Type
New Conventional
Estimated Equity
$710,330
Purchase Details
Closed on
Aug 15, 2007
Sold by
Creech Construction Co
Bought by
Barker William Bryant and Barker Jaclyn Boyd
Home Financials for this Owner
Home Financials are based on the most recent Mortgage that was taken out on this home.
Original Mortgage
$408,000
Interest Rate
6.56%
Mortgage Type
Purchase Money Mortgage
Purchase Details
Closed on
Aug 24, 1999
Sold by
Lee Jimmy Dale and Johnson Jo Lynn
Bought by
Boshoff Construction Inc
Create a Home Valuation Report for This Property
The Home Valuation Report is an in-depth analysis detailing your home's value as well as a comparison with similar homes in the area
Home Values in the Area
Average Home Value in this Area
Purchase History
| Date | Buyer | Sale Price | Title Company |
|---|---|---|---|
| Martin William Arthur | $525,000 | None Available | |
| Barker William Bryant | $510,000 | None Available | |
| Boshoff Construction Inc | $182,000 | -- |
Source: Public Records
Mortgage History
| Date | Status | Borrower | Loan Amount |
|---|---|---|---|
| Open | Martin William Arthur | $300,000 | |
| Previous Owner | Barker William Bryant | $408,000 |
Source: Public Records
Tax History Compared to Growth
Tax History
| Year | Tax Paid | Tax Assessment Tax Assessment Total Assessment is a certain percentage of the fair market value that is determined by local assessors to be the total taxable value of land and additions on the property. | Land | Improvement |
|---|---|---|---|---|
| 2025 | $7,811 | $893,363 | $220,000 | $673,363 |
| 2024 | $7,779 | $893,363 | $220,000 | $673,363 |
| 2023 | $6,327 | $578,602 | $115,500 | $463,102 |
| 2022 | $5,878 | $578,602 | $115,500 | $463,102 |
| 2021 | $5,650 | $578,602 | $115,500 | $463,102 |
| 2020 | $5,547 | $578,602 | $115,500 | $463,102 |
| 2019 | $5,844 | $502,566 | $99,000 | $403,566 |
| 2018 | $5,511 | $502,566 | $99,000 | $403,566 |
| 2017 | $5,248 | $502,566 | $99,000 | $403,566 |
| 2016 | $5,140 | $502,566 | $99,000 | $403,566 |
| 2015 | $5,154 | $495,814 | $90,000 | $405,814 |
| 2014 | $4,888 | $495,814 | $90,000 | $405,814 |
Source: Public Records
Map
Nearby Homes
- 712 Grayhaven Place
- Lot 14 Grayhaven Place
- 728 Powell Dr
- 724 Powell Dr
- 700 Grayhaven Place
- 722 Powell Dr
- 715 Powell Dr
- 808 Ravenwood Dr
- 618 Powell Dr
- 613 Powell Dr
- 2114 Scarlet Maple Dr
- 611 Powell Dr
- 1115 Bayfield Dr
- 3916 Wendy Ln Unit 8B2
- 3952 Wendy Ln
- 5045 Lundy Dr Unit 101
- 5049 Lundy Dr Unit 102
- 5053 Lundy Dr Unit 101
- 5101 Wickham Rd
- 5061 Lundy Dr Unit 102
- 741 Powell Dr
- 5124 Huntingdon Dr
- 749 Powell Dr
- 5120 Huntingdon Dr
- 739 Powell Dr
- 5116 Huntingdon Dr
- 753 Powell Dr
- 735 Powell Dr
- 5112 Huntingdon Dr
- 5108 Huntingdon Dr
- 1308 Pitkin Ct
- 732 Powell Dr
- 5125 Huntingdon Dr
- 5129 Huntingdon Dr
- 5121 Huntingdon Dr
- 1304 Pitkin Ct
- 5117 Huntingdon Dr
- 5133 Huntingdon Dr
- Lot 12 Grayhaven Place
- 5104 Huntingdon Dr