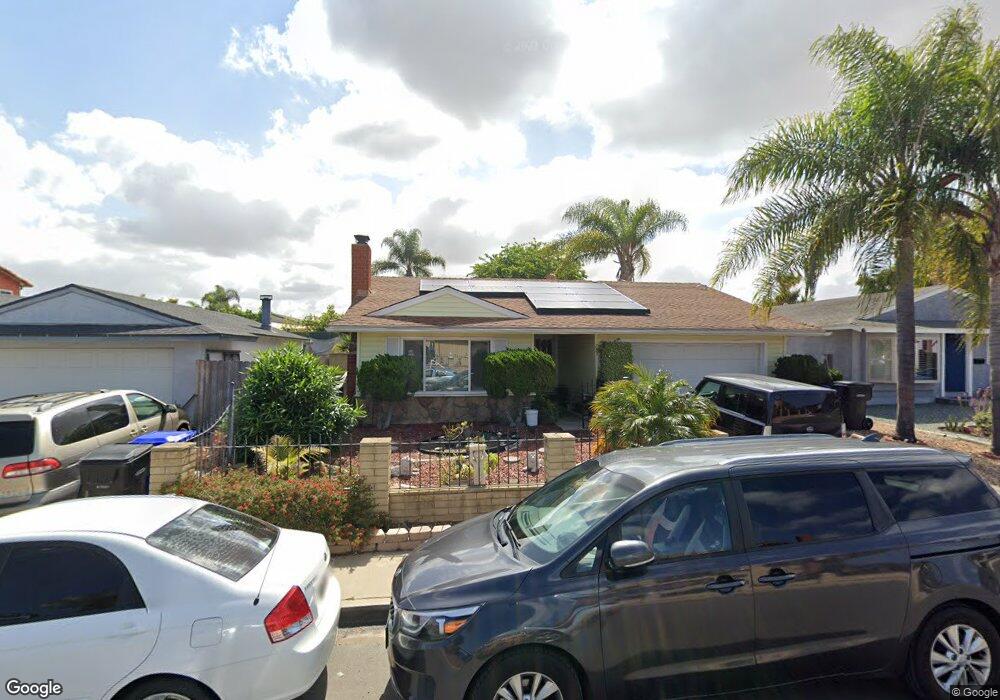
745 Ralph Way San Diego, CA 92154
Otay Mesa West NeighborhoodEstimated Value: $713,625 - $810,000
3
Beds
2
Baths
1,460
Sq Ft
$527/Sq Ft
Est. Value
About This Home
This home is located at 745 Ralph Way, San Diego, CA 92154 and is currently estimated at $769,906, approximately $527 per square foot. 745 Ralph Way is a home located in San Diego County with nearby schools including Silver Wing Elementary School, Montgomery Middle School, and Montgomery Senior High School.
Ownership History
Date
Name
Owned For
Owner Type
Purchase Details
Closed on
Jan 22, 2009
Sold by
Federal Home Loan Mortgage Corporation
Bought by
Molina Gustavo and Molina Alicia
Current Estimated Value
Home Financials for this Owner
Home Financials are based on the most recent Mortgage that was taken out on this home.
Original Mortgage
$230,743
Outstanding Balance
$143,733
Interest Rate
4.91%
Mortgage Type
FHA
Estimated Equity
$626,173
Purchase Details
Closed on
Nov 7, 2008
Sold by
Valencia Oscar and Valencia Monica
Bought by
Federal Home Loan Mortgage Corporation
Purchase Details
Closed on
Sep 14, 2005
Sold by
Bozen Henry Daryl and Bozen Vernie C
Bought by
Valencia Oscar and Valencia Monica
Home Financials for this Owner
Home Financials are based on the most recent Mortgage that was taken out on this home.
Original Mortgage
$99,600
Interest Rate
5.25%
Mortgage Type
Stand Alone Second
Create a Home Valuation Report for This Property
The Home Valuation Report is an in-depth analysis detailing your home's value as well as a comparison with similar homes in the area
Home Values in the Area
Average Home Value in this Area
Purchase History
| Date | Buyer | Sale Price | Title Company |
|---|---|---|---|
| Molina Gustavo | $235,000 | Ticor Title Redlands | |
| Federal Home Loan Mortgage Corporation | $254,900 | Accommodation | |
| Valencia Oscar | $498,000 | Commonwealth Title |
Source: Public Records
Mortgage History
| Date | Status | Borrower | Loan Amount |
|---|---|---|---|
| Open | Molina Gustavo | $230,743 | |
| Previous Owner | Valencia Oscar | $99,600 | |
| Previous Owner | Valencia Oscar | $398,400 |
Source: Public Records
Tax History Compared to Growth
Tax History
| Year | Tax Paid | Tax Assessment Tax Assessment Total Assessment is a certain percentage of the fair market value that is determined by local assessors to be the total taxable value of land and additions on the property. | Land | Improvement |
|---|---|---|---|---|
| 2025 | $3,435 | $302,606 | $128,767 | $173,839 |
| 2024 | $3,435 | $296,674 | $126,243 | $170,431 |
| 2023 | $3,386 | $290,858 | $123,768 | $167,090 |
| 2022 | $3,288 | $285,156 | $121,342 | $163,814 |
| 2021 | $3,211 | $279,565 | $118,963 | $160,602 |
| 2020 | $3,134 | $276,700 | $117,744 | $158,956 |
| 2019 | $3,052 | $271,276 | $115,436 | $155,840 |
| 2018 | $3,003 | $265,958 | $113,173 | $152,785 |
| 2017 | $2,939 | $260,744 | $110,954 | $149,790 |
| 2016 | $2,869 | $255,632 | $108,779 | $146,853 |
| 2015 | $2,827 | $251,794 | $107,146 | $144,648 |
| 2014 | $2,779 | $246,863 | $105,048 | $141,815 |
Source: Public Records
Map
Nearby Homes
- 4026 Coleman Ave
- 4205 Rene Dr
- 4250 Lemonseed Dr
- 3971 Caseman Ave
- 823 Fuchsia Ln
- 3753 Coleman Ave
- 1185 Ransom St
- 414 Palm Ave
- 3672 Byrd St
- 321 Palm Ave
- 237 Rancho Dr Unit C
- 234 Date St
- 935 Caleb Ct
- 3470 Robb Roy Place
- 3443 Alonquin Way
- 4558 Northern Moon Way
- 1378 Starry Way
- 4151 Alcorn St
- 1720 Melrose Ave Unit 27
- 3965 Otay Valley Rd